HOT TOPICS LIST
- MACD
- Fibonacci
- RSI
- Gann
- ADXR
- Stochastics
- Volume
- Triangles
- Futures
- Cycles
- Volatility
- ZIGZAG
- MESA
- Retracement
- Aroon
INDICATORS LIST
LIST OF TOPICS
PRINT THIS ARTICLE
by Mike Carr, CMT
With the market looking vulnerable, an online gaming company based in China is worth looking at as a short candidate.
Position: Sell
Mike Carr, CMT
Mike Carr, CMT, is a member of the Market Technicians Association, and editor of the MTA's newsletter, Technically Speaking. He is also the author of "Smarter Investing in Any Economy: The Definitive Guide to Relative Strength Investing," and "Conquering the Divide: How to Use Economic Indicators to Catch Stock Market Trends."
PRINT THIS ARTICLE
STRATEGIES
Shanda Interactive: A Short Setup
06/11/08 08:21:40 AMby Mike Carr, CMT
With the market looking vulnerable, an online gaming company based in China is worth looking at as a short candidate.
Position: Sell
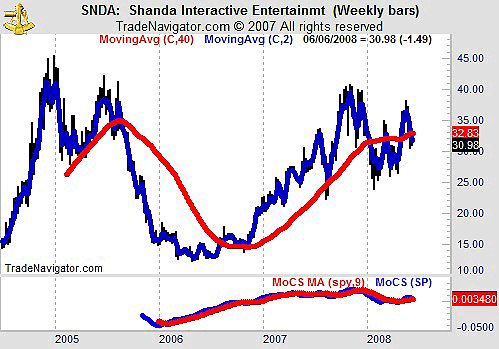
| Shanda Interactive (SNDA) is a speculative company with deteriorating technicals. Starting with the weekly chart (Figure 1), we can see that the short-term, two-week moving average has just fallen below the longer-term, 40-week moving average. These time frames are used in the weekly chart to show more data, but traders are more likely to look at 10-day and 200-day moving averages. In the weekly chart, we see that this crossover has been a reliable signal of trend change in the past. The current crossover is accompanied by declining momentum. The momentum of comparative strength indicator is similar to a moving average convergence/divergence (MACD) but allows us to chart relative strength with a timing signal on the stock chart. This indicator shows that momentum, like the moving averages, has just completed a bearish crossover. |

|
| FIGURE 1: SNDA, WEEKLY. Momentum, as measured by the momentum of comparative strength (MOCS), is headed lower as the 10-day moving average completes a bearish crossing of the 200-day moving average. |
| Graphic provided by: Trade Navigator. |
| |
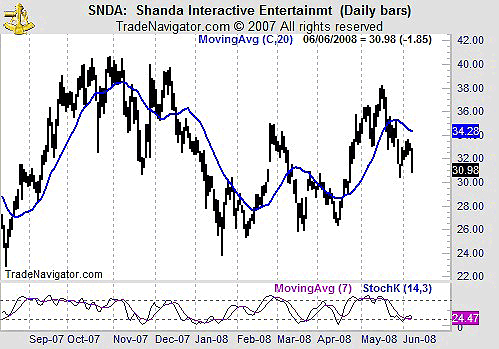
| Turning to the daily chart (Figure 2), we can see that prices are below their 20-day moving average, and the stochastics indicator is bearish. Stochastics turned lower after unsuccessfully attempting to rally from an oversold condition. This behavior is reminiscent of the action in December 2007, when prices were also below their 20-day moving average. |

|
| FIGURE 2: SNDA, DAILY. The daily chart of SNDA is also bearish. |
| Graphic provided by: Trade Navigator. |
| |
| SNDA represents a solid shorting opportunity. Aggressive traders should short the stock immediately. Conservative traders can short below support at 27. The target would be long-term support visible in the weekly chart near 12, although this position would need to use a trailing stop given its long-term volatility. The 20-day moving average provides a reasonable stop-loss level for all traders. |
Mike Carr, CMT, is a member of the Market Technicians Association, and editor of the MTA's newsletter, Technically Speaking. He is also the author of "Smarter Investing in Any Economy: The Definitive Guide to Relative Strength Investing," and "Conquering the Divide: How to Use Economic Indicators to Catch Stock Market Trends."
| Website: | www.moneynews.com/blogs/MichaelCarr/id-73 |
| E-mail address: | marketstrategist@gmail.com |
Click here for more information about our publications!
Comments
Date: 06/11/08Rank: 2Comment:

Request Information From Our Sponsors
- StockCharts.com, Inc.
- Candle Patterns
- Candlestick Charting Explained
- Intermarket Technical Analysis
- John Murphy on Chart Analysis
- John Murphy's Chart Pattern Recognition
- John Murphy's Market Message
- MurphyExplainsMarketAnalysis-Intermarket Analysis
- MurphyExplainsMarketAnalysis-Visual Analysis
- StockCharts.com
- Technical Analysis of the Financial Markets
- The Visual Investor
- VectorVest, Inc.
- Executive Premier Workshop
- One-Day Options Course
- OptionsPro
- Retirement Income Workshop
- Sure-Fire Trading Systems (VectorVest, Inc.)
- Trading as a Business Workshop
- VectorVest 7 EOD
- VectorVest 7 RealTime/IntraDay
- VectorVest AutoTester
- VectorVest Educational Services
- VectorVest OnLine
- VectorVest Options Analyzer
- VectorVest ProGraphics v6.0
- VectorVest ProTrader 7
- VectorVest RealTime Derby Tool
- VectorVest Simulator
- VectorVest Variator
- VectorVest Watchdog
