HOT TOPICS LIST
- MACD
- Fibonacci
- RSI
- Gann
- ADXR
- Stochastics
- Volume
- Triangles
- Futures
- Cycles
- Volatility
- ZIGZAG
- MESA
- Retracement
- Aroon
INDICATORS LIST
LIST OF TOPICS
PRINT THIS ARTICLE
by Ron Walker
The Standard & Poor's 500 is forming a head & shoulders top near the 200-day simple moving average. An advance block pattern is helping to complete the right shoulder.
Position: N/A
Ron Walker
Ron Walker is an active trader and technical analyst. He operates an educational website dedicated to the study of Technical Analysis. The website offers free market analysis with daily video presentations and written commentaries. Ron is a video pioneer, being one of the first to utilize the internet producing Technical Analysis videos. His website is thechartpatterntrader.com
PRINT THIS ARTICLE
CANDLESTICK CHARTING
An Advance Block For The S&P 500
06/05/08 01:38:11 PMby Ron Walker
The Standard & Poor's 500 is forming a head & shoulders top near the 200-day simple moving average. An advance block pattern is helping to complete the right shoulder.
Position: N/A
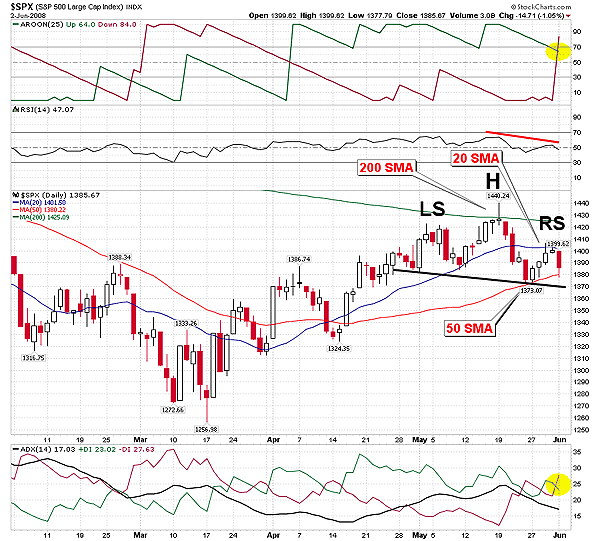
| The Standard & Poor's 500 has performed nicely during the runup from the March 17th low to our recent highs in mid-May. It has risen with little corrective moves along the journey higher. Figure 1 reveals that recently the S&P 500 tagged its 200-day simple moving average (SMA), where it found resistance in the form of a gravestone doji candlestick. Price wasn't able to conquer it, having failed to close above the 200-day SMA. The S&P then broke below support at 1383, as it drifted down to rest on the 50-day SMA at 1373. It suffered considerable technical damage. Finally, the 50-day SMA managed to resurrect the index, as the entire market fared well during a short-term tech rally for the next four trading sessions. |

|
| FIGURE 1: $SPX, DAILY. The S&P 500 looks to be in the last stages of completing a right shoulder in a head & shoulders pattern that has been developing since late April. It is trapped between support at the 50-day SMA at 1380, and resistance at the 20-day SMA near 1400. |
| Graphic provided by: StockCharts.com. |
| |
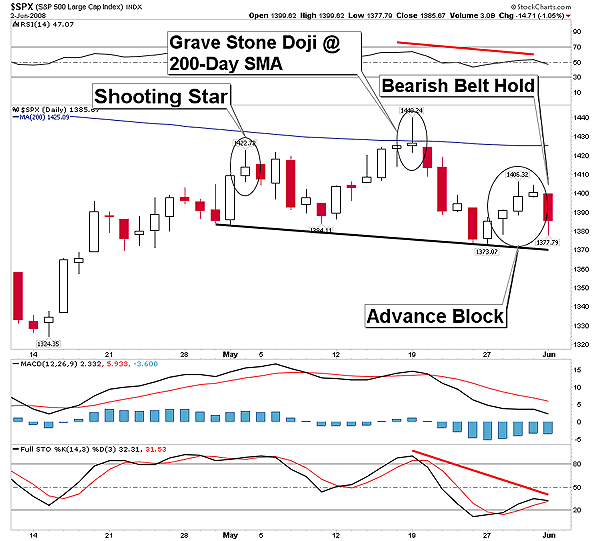
| As the S&P marched back up to recoup the previous weeks losses, it ran into resistance at the 20-day SMA. The S&P 500 became trapped between support and resistance, trading in a narrow range with the 50-day SMA support level at 1380 and the 20-day SMA resistance near 1400. Although its technical condition improved rising back up to the 20-day SMA, it was not enough to make up for all the damage suffered from the previous week. Further, a bearish candlestick pattern had now formed on the index during the rally, which is displayed in Figure 2. An advance block pattern is a three-day candlestick pattern that is bearish. It looks similar to a three-white soldier pattern, but a three-white soldier pattern occurs in a downtrend and is a bullish reversal pattern while the advance block occurs in an uptrend and is a bearish pattern. The advance block is characterized by the first day being bullish, but the second and third days form long shadows above the real body of their candlesticks. The long shadows above the candlesticks signal that sellers are coming into the market at these levels. |

|
| FIGURE 2: $SPX, DAILY. A bearish belt hold candlestick confirms suspicion of an advance block pattern, which is setting up a right shoulder. Note how each peak got a bearish candle pattern as the 200-day SMA is lurking above a potential bearish head & shoulders top. |
| Graphic provided by: StockCharts.com. |
| |
| On the next trading session, on June 2, the pattern began to play out as a bearish belt hold candlestick appeared (Figure 2). By this time you can see that a head & shoulders top is forming; the last stages of a right shoulder is almost completed. The neckline is slanting downward, pointing toward 1370. A break below that confirmation line will validate the pattern. The pattern measures approximately 70 points with an objective target near 1300. If prices break below the last minor low of 1373, a downward trend will be established with a lower high and a lower low in place. Moreover, the belt hold candlestick caused the relative strength index (RSI) (14) to form a negative simple divergence, while the stochastic (14, 3, 3 ) indicator starts hooking down. In Figure 1, the Aroon (25) got a bearish cross, with the Aroon down (red line) crossing above the Aroon up (green line) as it moved above the value of 70. It is signaling that the trend is feeble. The Aroon down needs to move below 30 to constitute a new downtrend. However, the average directional movement index (ADX) (14) with plus (+DI) and minus (-DI) directional indicators is signaling a trendless environment. The ADX is wandering below 20, as the plus and minus DI lines continue to crisscross as they weave together back and forth. Nevertheless, the indicator still implies weakness of the previous advance. This setup looks ripe for short-sellers. |
| The S&P 500 has had a huge run since the March low, rising a hefty 14.65% from its 1256 intraday low to the 1440 intraday May peak. If we were to just use the closing low of 1273 on March 10, to the closing high of 1429 made on May 19, the S&P 500 still rose a whopping 12% in just over two months. The S&P will likely fall to test the last significant minor low of 1324. The 50% and the 61.8% Fibonacci retracements are likely areas where the S&P will find support. Once the market has a chance to catch its breath, I believe that it will ultimately resume the advance exceeding the May high. The stock market looks forward, and the second half of the year continues to look much better. But for now, it appears that the S&P 500 is developing a contratrend. |
Ron Walker is an active trader and technical analyst. He operates an educational website dedicated to the study of Technical Analysis. The website offers free market analysis with daily video presentations and written commentaries. Ron is a video pioneer, being one of the first to utilize the internet producing Technical Analysis videos. His website is thechartpatterntrader.com
| Website: | thechartpatterntrader.com |
| E-mail address: | thechartpatterntrader@gmail.com |
Click here for more information about our publications!
Comments
Date: 06/09/08Rank: 4Comment:

Request Information From Our Sponsors
- VectorVest, Inc.
- Executive Premier Workshop
- One-Day Options Course
- OptionsPro
- Retirement Income Workshop
- Sure-Fire Trading Systems (VectorVest, Inc.)
- Trading as a Business Workshop
- VectorVest 7 EOD
- VectorVest 7 RealTime/IntraDay
- VectorVest AutoTester
- VectorVest Educational Services
- VectorVest OnLine
- VectorVest Options Analyzer
- VectorVest ProGraphics v6.0
- VectorVest ProTrader 7
- VectorVest RealTime Derby Tool
- VectorVest Simulator
- VectorVest Variator
- VectorVest Watchdog
- StockCharts.com, Inc.
- Candle Patterns
- Candlestick Charting Explained
- Intermarket Technical Analysis
- John Murphy on Chart Analysis
- John Murphy's Chart Pattern Recognition
- John Murphy's Market Message
- MurphyExplainsMarketAnalysis-Intermarket Analysis
- MurphyExplainsMarketAnalysis-Visual Analysis
- StockCharts.com
- Technical Analysis of the Financial Markets
- The Visual Investor
