HOT TOPICS LIST
- MACD
- Fibonacci
- RSI
- Gann
- ADXR
- Stochastics
- Volume
- Triangles
- Futures
- Cycles
- Volatility
- ZIGZAG
- MESA
- Retracement
- Aroon
INDICATORS LIST
LIST OF TOPICS
PRINT THIS ARTICLE
by Alan R. Northam
The Financials Select Sector SPDR has now been in a downtrend for more than a year, but the worst is yet to come. XLF is on the verge of spiraling down as Elliott wave 3 gets under way.
Position: N/A
Alan R. Northam
Alan Northam lives in the Dallas, Texas area and as an electronic engineer gave him an analytical mind from which he has developed a thorough knowledge of stock market technical analysis. His abilities to analyze the future direction of the stock market has allowed him to successfully trade of his own portfolio over the last 30 years. Mr. Northam is now retired and trading the stock market full time. You can reach him at inquiry@tradersclassroom.com or by visiting his website at http://www.tradersclassroom.com. You can also follow him on Twitter @TradersClassrm.
PRINT THIS ARTICLE
ELLIOTT WAVE
XLF Starting Downward Spiral
06/04/08 09:01:20 AMby Alan R. Northam
The Financials Select Sector SPDR has now been in a downtrend for more than a year, but the worst is yet to come. XLF is on the verge of spiraling down as Elliott wave 3 gets under way.
Position: N/A
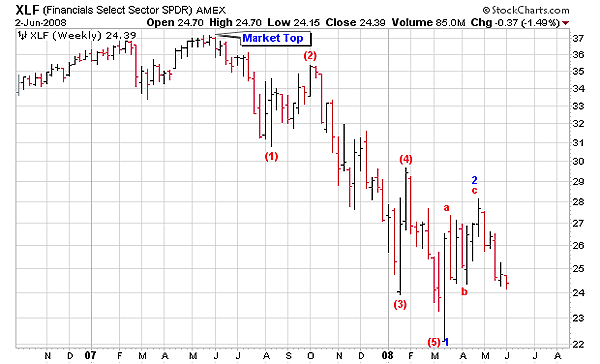
| Figure 1 shows the weekly price chart of the Financial Select Sector SPDR (XLF). In this chart see that XLF made a major bull market top in May 2007. Since then, XLF has been trading in the downward direction and has formed an impulse wave made up of waves (1), (2), (3), (4), and (5), completing the larger wave 1 down. R.N. Elliott, who discovered the wave principle, stated more than 70 years ago that impulse waves define the major trend in the market. With the completion of the first impulse wave from the major bull market top, XLF is now defined as being in a bear market trend. Further, since May 2007, XLF has now completed waves 1 and 2 of a much larger impulse wave to be made up of waves 1, 2, 3, 4, and 5. Wave 1 always travels in the direction of the major trend and is made up of five smaller waves. Wave 2 is always a corrective wave made up of three waves, waves a, b, and c, and moves against the direction of wave 1, correcting the price movement of wave 1. Elliott wave convention labels impulse waves with numbers and corrective waves with letters. Wave 3 is another wave that travels in the direction of the major trend and is made up of five smaller waves. Wave 4, like wave 2, is always a corrective wave made up of three waves, waves a, b, and c, and moves against the direction of wave 3 correcting the price movement of wave 3. And finally, wave 5 is also made up of five smaller waves and moves in the direction of the major trend. As we can see from Figure 1, wave 2 is now complete, and wave 3 down, which will be made up of five smaller waves, is now under way. |

|
| FIGURE 1: XLF, WEEKLY. Simply stated, the Elliott wave principle defines the direction of a major trend to be in the same direction as five nonoverlapping waves. |
| Graphic provided by: StockCharts.com. |
| |
| Two characteristics of wave 3 is that they are never the shortest wave and is most often the longest of waves 1, 3, and 5. Another characteristic of wave 3 is that they normally move quickly with the greatest amount of momentum of any other wave. Therefore, we can expect wave 3 to spiral downward quickly during the weeks ahead. |
| One way that we can tell that wave 3 down is now under way is by going to a smaller time frame, such as the daily price chart, to see if we can find smaller impulse waves that have subdivided into five smaller waves in the downward direction. This will then define the current trend from the early May price peak as being in the downward direction. |
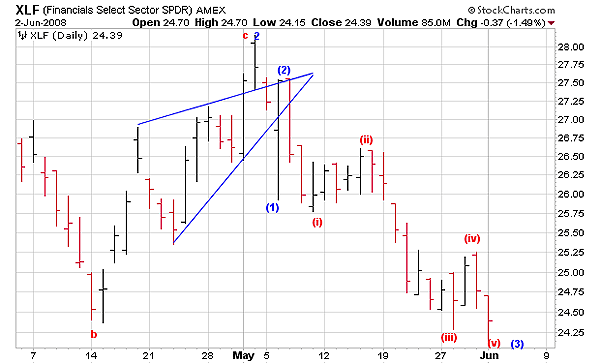
| Looking at Figure 2, note that wave 2 ended in early May 2008. Since that time, XLF has been moving lower and has formed subwaves (1), (2), and wave (3) of a five-wave impulse wave in the downward direction (it is not yet clear if wave (3) is complete yet). However, note that the impulse wave is not complete and so we cannot count five waves down. But since we can count three of the five waves, we have a pretty good idea that XLF is now moving lower and will eventually complete the five subwaves necessary to verify that the market is trading lower and that wave 3 down on the weekly chart is under way. There is another way of verifying that XLF is now trending in the downward direction and that the selloff from early May is not part of the market correction that started in March. Look at subwave (3) down. Note that it is also made up of five subwaves — waves (i), (ii), (iii), (iv), and (v). These five waves also form a small impulse wave, and as we know, impulse waves move in the direction of the larger trend, which in the case of XLF is down. Therefore, these five small subwaves tell us that the larger trend made up of waves (1), (2), and (3) are moving in the downward direction. This then helps to verify that waves (1), (2), and (3) are part of a larger impulse wave, to be made up of waves (1), (2), (3), (4), and (5), that then define that the major trend of XLF is in the downward direction. This then helps to verify that wave 3 down on the weekly chart is under way and that XLF is starting its downward spiral to much lower prices. |

|
| FIGURE 2: XLF, DAILY. This chart, which shows the Elliott wave count, also shows that wave (3), part of a larger five-wave impulse wave, is also made up of five nonoverlapping waves defining the direction of the trend as being in the downward direction. |
| Graphic provided by: StockCharts.com. |
| |
Alan Northam lives in the Dallas, Texas area and as an electronic engineer gave him an analytical mind from which he has developed a thorough knowledge of stock market technical analysis. His abilities to analyze the future direction of the stock market has allowed him to successfully trade of his own portfolio over the last 30 years. Mr. Northam is now retired and trading the stock market full time. You can reach him at inquiry@tradersclassroom.com or by visiting his website at http://www.tradersclassroom.com. You can also follow him on Twitter @TradersClassrm.
| Garland, Tx | |
| Website: | www.tradersclassroom.com |
| E-mail address: | inquiry@tradersclassroom.com |
Click here for more information about our publications!
Comments
Date: 06/08/08Rank: 4Comment:
Date: 06/10/08Rank: Comment: Here you say Financials are spiraling down. How do you reconcile that with GLD is going down 34%? It isn t likely that Financials will go down and gold will follow along in sympathy.

Request Information From Our Sponsors
- StockCharts.com, Inc.
- Candle Patterns
- Candlestick Charting Explained
- Intermarket Technical Analysis
- John Murphy on Chart Analysis
- John Murphy's Chart Pattern Recognition
- John Murphy's Market Message
- MurphyExplainsMarketAnalysis-Intermarket Analysis
- MurphyExplainsMarketAnalysis-Visual Analysis
- StockCharts.com
- Technical Analysis of the Financial Markets
- The Visual Investor
- VectorVest, Inc.
- Executive Premier Workshop
- One-Day Options Course
- OptionsPro
- Retirement Income Workshop
- Sure-Fire Trading Systems (VectorVest, Inc.)
- Trading as a Business Workshop
- VectorVest 7 EOD
- VectorVest 7 RealTime/IntraDay
- VectorVest AutoTester
- VectorVest Educational Services
- VectorVest OnLine
- VectorVest Options Analyzer
- VectorVest ProGraphics v6.0
- VectorVest ProTrader 7
- VectorVest RealTime Derby Tool
- VectorVest Simulator
- VectorVest Variator
- VectorVest Watchdog
