HOT TOPICS LIST
- MACD
- Fibonacci
- RSI
- Gann
- ADXR
- Stochastics
- Volume
- Triangles
- Futures
- Cycles
- Volatility
- ZIGZAG
- MESA
- Retracement
- Aroon
INDICATORS LIST
LIST OF TOPICS
PRINT THIS ARTICLE
by James Kupfer
The US Dollar Index recently created an upward sloping linear regression channel.
Position: Accumulate
James Kupfer
Mr. Kupfer is a market professional and amateur stock market commentator. Disclosure: It is likely that Mr. Kupfer has or will enter a position in any security he writes about.
PRINT THIS ARTICLE
LINEAR REG CHANNEL
A Fragile Dollar Uptrend
06/03/08 11:06:32 AMby James Kupfer
The US Dollar Index recently created an upward sloping linear regression channel.
Position: Accumulate
| Given the recent price action in the US Dollar Index, it is now possible to construct a linear regression channel showing the current price trend. Although the trend is very young and thus prone to potential failure, at this junction the direction is up and therefore represents a potential market bottom for the multiyear decline the dollar has experienced. |
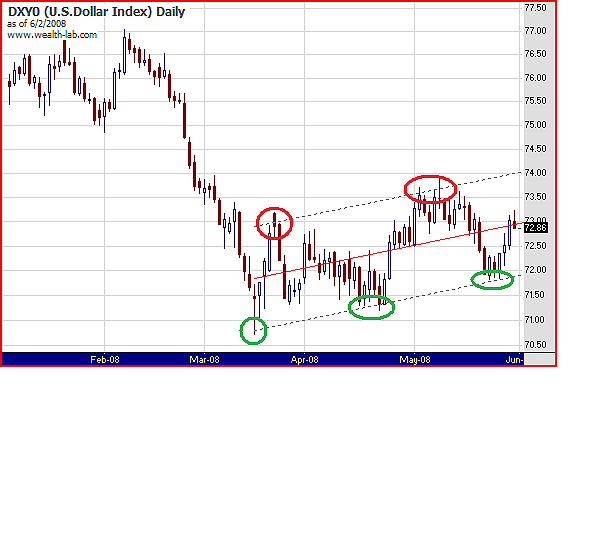
| As shown in Figure 1, the red line is a linear regression line between the March low and today's prices. A linear regression line is drawn using the method of least squares, thus making it the median line of price action. Above and below the linear regression line are the two channel lines from which are created two standard deviations from the center regression line. In essence, these channel lines act as support (lower line) and resistance (upper line) for a security. |

|
| FIGURE 1: US DOLLAR, DAILY. The red line is a linear regression line between the March low and today's prices. |
| Graphic provided by: Wealth-Lab. |
| |
| While it can be a somewhat subjective matter to create and use linear regression channels, they can do a great job of representing the current trend. In this case, you can see that the dollar has held support at each of the green circles. The red circles represent where resistance has been touched. When the dollar eventually trades for an extended period of time outside the channel bands, it may signal as a trend change. Until then, expect the dollar to continue to move slowly upward. |
Mr. Kupfer is a market professional and amateur stock market commentator. Disclosure: It is likely that Mr. Kupfer has or will enter a position in any security he writes about.
Click here for more information about our publications!
Comments

Request Information From Our Sponsors
- StockCharts.com, Inc.
- Candle Patterns
- Candlestick Charting Explained
- Intermarket Technical Analysis
- John Murphy on Chart Analysis
- John Murphy's Chart Pattern Recognition
- John Murphy's Market Message
- MurphyExplainsMarketAnalysis-Intermarket Analysis
- MurphyExplainsMarketAnalysis-Visual Analysis
- StockCharts.com
- Technical Analysis of the Financial Markets
- The Visual Investor
- VectorVest, Inc.
- Executive Premier Workshop
- One-Day Options Course
- OptionsPro
- Retirement Income Workshop
- Sure-Fire Trading Systems (VectorVest, Inc.)
- Trading as a Business Workshop
- VectorVest 7 EOD
- VectorVest 7 RealTime/IntraDay
- VectorVest AutoTester
- VectorVest Educational Services
- VectorVest OnLine
- VectorVest Options Analyzer
- VectorVest ProGraphics v6.0
- VectorVest ProTrader 7
- VectorVest RealTime Derby Tool
- VectorVest Simulator
- VectorVest Variator
- VectorVest Watchdog
