HOT TOPICS LIST
- MACD
- Fibonacci
- RSI
- Gann
- ADXR
- Stochastics
- Volume
- Triangles
- Futures
- Cycles
- Volatility
- ZIGZAG
- MESA
- Retracement
- Aroon
INDICATORS LIST
LIST OF TOPICS
PRINT THIS ARTICLE
by Alan R. Northam
USO has been in a bull market since 1999. However, there is a high probability of overhead resistance that could turn this fund downward for a selloff of as much as 62%.
Position: N/A
Alan R. Northam
Alan Northam lives in the Dallas, Texas area and as an electronic engineer gave him an analytical mind from which he has developed a thorough knowledge of stock market technical analysis. His abilities to analyze the future direction of the stock market has allowed him to successfully trade of his own portfolio over the last 30 years. Mr. Northam is now retired and trading the stock market full time. You can reach him at inquiry@tradersclassroom.com or by visiting his website at http://www.tradersclassroom.com. You can also follow him on Twitter @TradersClassrm.
PRINT THIS ARTICLE
ELLIOTT WAVE
Is USO Ready To Turn Lower?
06/02/08 10:35:24 AMby Alan R. Northam
USO has been in a bull market since 1999. However, there is a high probability of overhead resistance that could turn this fund downward for a selloff of as much as 62%.
Position: N/A
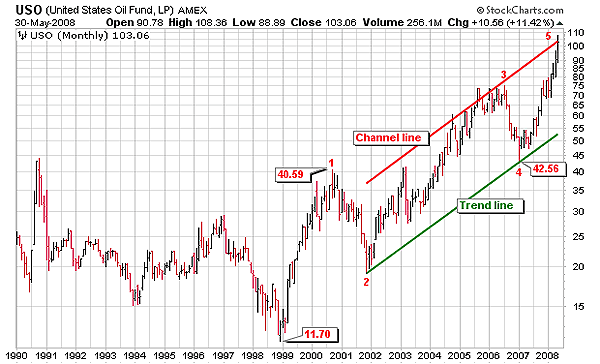
| When looking at Figure 1, the monthly chart, note the United States Oil Fund (USO) has been in a bull market since the beginning of 1999. During that time, USO has traced out an Elliott impulse wave composed of five waves, waves 1, 2, 3, 4, and 5. However, note that wave 5 is still rising and has not formed a peak yet by turning back down to correct its bullish price action that started at the beginning of 2007. Once wave 5 is complete, we can expect a market correction that could result in a selloff of up to 62% of the price movement from 1999. This could result in a price of about $50 for USO once this correction is complete. The Elliott wave theory gives us several ways to determine when the price should peak and turn back down to start this market correction. |

|
| FIGURE 1: USO, MONTHLY. The monthly price chart of USO shows the Elliott wave count and channeling. |
| Graphic provided by: StockCharts.com. |
| |
| One way in which to determine if the price is ready to turn back down is through the use of channeling. Channeling is where a trendline is drawn from the extreme of wave 2 to the extreme price of wave 4. A line is then drawn in parallel to this trendline and then extended upward to the ending price of wave 3. This line is called the channel line. According to Elliott, we can expect the market to turn back down once it hits this channel line. Looking at Figure 1, we note that the price has moved up to the channel line so we can expect oil to start to turn in the near future and head lower. Elliott also gives us another way to determine if the price is ready to turn back down. This second approach multiplies the length of wave 1 by the Fibonacci numbers or 0.5, 0.618, 1, 1.618, 2, 2.618, and so on to determine price levels at which the price could turn back down. When applying multiples of these Fibonacci numbers to the length of wave 1, I see that USO has met the condition at which the price could turn back down when I use the Fibonacci number of 2. When I take the length of wave 1 (40.59 - 11.70 = 28.89), I get 28.89. I then multiply 28.89 by 2 and get 57.78. I then add 57.78 to the start of wave 5 (42.56) and get 100.34. As we can see from the monthly price chart, USO closed the month of May 2008 at 103.06, meeting this price objective. Therefore, now would be an expected time for USO to turn back down. However, it is always possible that wave 5 could extend higher. Should USO continue higher, the next expected turn price would be at the Fibonacci multiple of 2.618 or 118.20, which would be the next price level at which to expect USO to turn back down. Should USO break out above 118.20, then it could move higher til the next Fibonacci multiple and so on. However, the evidence shows that at the current price level, there is a high probability for oil to turn back down. First, it has reached the upper channel line, and second, it has met a Fibonacci multiple. Therefore, I wouldn't be surprised to see oil start to move lower in June. Let's extend our analysis now and see what we can detect from the daily price chart for USO. |

|
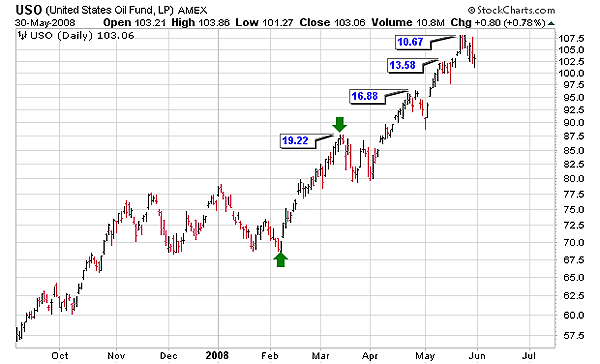
| FIGURE 2: USO, DAILY. The daily price chart of USO shows wave lengths. |
| Graphic provided by: StockCharts.com. |
| |
| When I look at the daily price chart for USO (see Figure 2), I note that USO is running up against resistance. But how do you determine resistance when price is at an all-time high and there is no previous price history of resistance areas to refer to? The way I have approached this problem is by comparing the lengths of each wave. For example, look at the length of the first wave that started in early February of this year and ended in mid-March. The length of this wave is $19.22. The next wave is $16.88, the next is $13.58, and the last is $10.67. As you can see, each successive wave is shorter than the previous, as USO is finding it harder and harder to move higher, indicating overhead resistance ahead. There is also a Fibonacci relationship to the compressing of these waves as USO tries to move higher. |

|
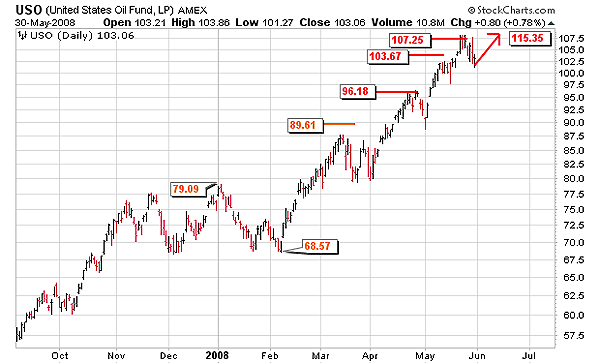
| FIGURE 3: USO, DAILY. The daily price chart shows wave price targets. |
| Graphic provided by: StockCharts.com. |
| |
| In Figure 3, I have shown another Fibonacci relationship to each of the waves beginning in 2008. I have taken the high price at the beginning of January (79.09) and subtracted it from the price low at the end of the corrective wave (68.57). I then multiplied this difference by the Fibonacci number of 2. I then added this sum to the price low (68.57) to get a target price for the next wave of 89.61. As you can see, the price came close to this target before turning back down in a corrective wave. I then used the same Fibonacci number of 2 for each successive wave to come up with the price target for each wave. As you can see from Figure 3, each rally came close to or met each of these price targets. A closer observation will show that every other price target wave hit. With an even closer observation and you will see that even though I am using the same Fibonacci multiple of 2, each successive wave peak is getting smaller and smaller. If this relationship continues to hold, as it has over the last four waves, USO will reach a point of diminishing returns where price cannot make any further head way in the upward direction. |

|
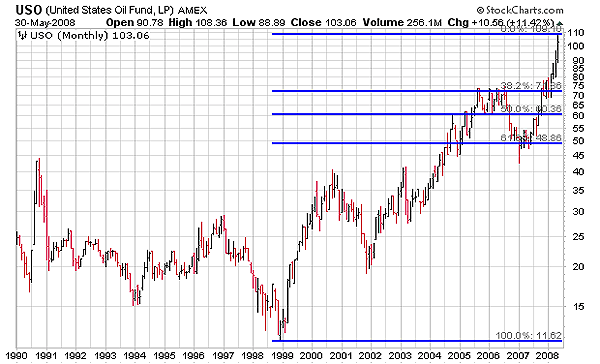
| FIGURE 4: USO, MONTHLY. The monthly price chart of USO shows Fibonacci retracement price levels. |
| Graphic provided by: StockCharts.com. |
| |
| Once the rally for USO that started in 1999 is complete, how much of a market correction can we expect to see? Based upon the past, it is common to see markets correct to price levels that are in close relationship to the Fibonacci number of 38.2%, 50%, and 61.8%. Should the market start to correct now from the closing price at the end of May 2008, then we can expect USO to sell off to around $72, $60, and $49, respectively. I have included again a monthly chart showing these Fibonacci retracement level relationships along with the price targets for USO in Figure 4. In conclusion, the monthly chart shows that USO has formed five waves in the upward direction and has reached its channel line, indicating that oil is now in a position of vulnerability where it could turn back down. The daily charts also reinforce this by pointing out that overhead resistance is looming above current price levels. Therefore, we should be on alert that there is a high probability for USO to turn back down at anytime now that could result in a selloff to a lower price target of as much as $49. |
Alan Northam lives in the Dallas, Texas area and as an electronic engineer gave him an analytical mind from which he has developed a thorough knowledge of stock market technical analysis. His abilities to analyze the future direction of the stock market has allowed him to successfully trade of his own portfolio over the last 30 years. Mr. Northam is now retired and trading the stock market full time. You can reach him at inquiry@tradersclassroom.com or by visiting his website at http://www.tradersclassroom.com. You can also follow him on Twitter @TradersClassrm.
| Garland, Tx | |
| Website: | www.tradersclassroom.com |
| E-mail address: | inquiry@tradersclassroom.com |
Click here for more information about our publications!
Comments
Date: 06/03/08Rank: 5Comment:
Date: 06/04/08Rank: 4Comment:

Request Information From Our Sponsors
- StockCharts.com, Inc.
- Candle Patterns
- Candlestick Charting Explained
- Intermarket Technical Analysis
- John Murphy on Chart Analysis
- John Murphy's Chart Pattern Recognition
- John Murphy's Market Message
- MurphyExplainsMarketAnalysis-Intermarket Analysis
- MurphyExplainsMarketAnalysis-Visual Analysis
- StockCharts.com
- Technical Analysis of the Financial Markets
- The Visual Investor
- VectorVest, Inc.
- Executive Premier Workshop
- One-Day Options Course
- OptionsPro
- Retirement Income Workshop
- Sure-Fire Trading Systems (VectorVest, Inc.)
- Trading as a Business Workshop
- VectorVest 7 EOD
- VectorVest 7 RealTime/IntraDay
- VectorVest AutoTester
- VectorVest Educational Services
- VectorVest OnLine
- VectorVest Options Analyzer
- VectorVest ProGraphics v6.0
- VectorVest ProTrader 7
- VectorVest RealTime Derby Tool
- VectorVest Simulator
- VectorVest Variator
- VectorVest Watchdog
