HOT TOPICS LIST
- MACD
- Fibonacci
- RSI
- Gann
- ADXR
- Stochastics
- Volume
- Triangles
- Futures
- Cycles
- Volatility
- ZIGZAG
- MESA
- Retracement
- Aroon
INDICATORS LIST
LIST OF TOPICS
PRINT THIS ARTICLE
by Chaitali Mohile
The breakout leads the DB Commodities Tracking Index Fund to a lifetime high. The index slipped below the new high and the slide may continue on weak trend notes.
Position: N/A
Chaitali Mohile
Active trader in the Indian stock markets since 2003 and a full-time writer. Trading is largely based upon technical analysis.
PRINT THIS ARTICLE
BREAKOUTS
DBC Fails To Hold Lifetime High
06/09/08 01:52:14 PMby Chaitali Mohile
The breakout leads the DB Commodities Tracking Index Fund to a lifetime high. The index slipped below the new high and the slide may continue on weak trend notes.
Position: N/A
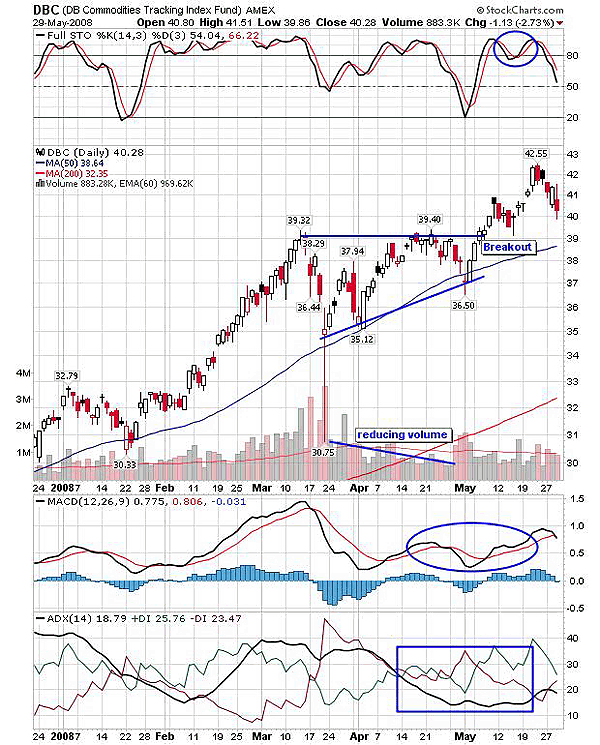
| DB Commodities Tracking Index (DBC) went through a strong upward rally after a sluggish move in January and February 2008. Once prices broke out above the range breakout in mid-February there was no slowing down and the volume was also encouraging. The price followed the 50-day moving average direction perfectly and consistently, and reached a new high at 39 in a month and half. The index at this level entered a bullish phase of consolidation after the prolonged upside journey. Sustaining higher levels is more important than losing all the profits earned as the indicators showed shaky moves at their highest levels. From Figure 1, you can see that the entire upward rally was pulled on the overbought stochastic (14,3,3) running in same area for an equally longer period of the rally. So even the consolidation has a wider range of 39-35 that narrowed further, but interestingly, the price rested on the support of 50-day moving average at the lowest consolidation level. |

|
| FIGURE 1: DBC, DAILY. The breakout made its lifetime high and is likely to retest the previous support. |
| Graphic provided by: StockCharts.com. |
| |
| The index rally has a robust bullish strength with the view that the stochastic (14,3,3) declined to an oversold area very fast, while the price held the moving average support -- not just stochastic, but the moving average convergence/divergence (MACD) (12,26,9) and the average directional movement index (ADX) (14) also turned out to be very volatile at these higher levels. But as they recovered their strength, the price immediately moved out of a consolidation period and rallied higher. Figure 1 shows a flag & pennant breakout supported by healthy volume. The breakout was surely a buying opportunity, and the traders on board must have enjoyed the rally, as the index was soon at its all-time high of 42.55. Our trading rules say that a stock that makes a new high runs higher in near term, so the trading positions can be carried forward. But here, the picture was different due to weakening oscillators and trends. |
| The index declined from the all-time high and is more likely to touch the support of upper range at 39 levels. As indicators are weakening, further support testing is more likely to happen. The stochastic (14,3,3) has already left behind its bullish levels and is heading downward. In addition, the MACD (12,26,9) is ready for a bearish crossover in positive territory, adding some more bearish pressure. In addition, the ADX (14) indicate a very weak trend to move the index higher. So the index lacks the strength to pull back, but resting on the upper range resistance converted to support is necessary. |

|
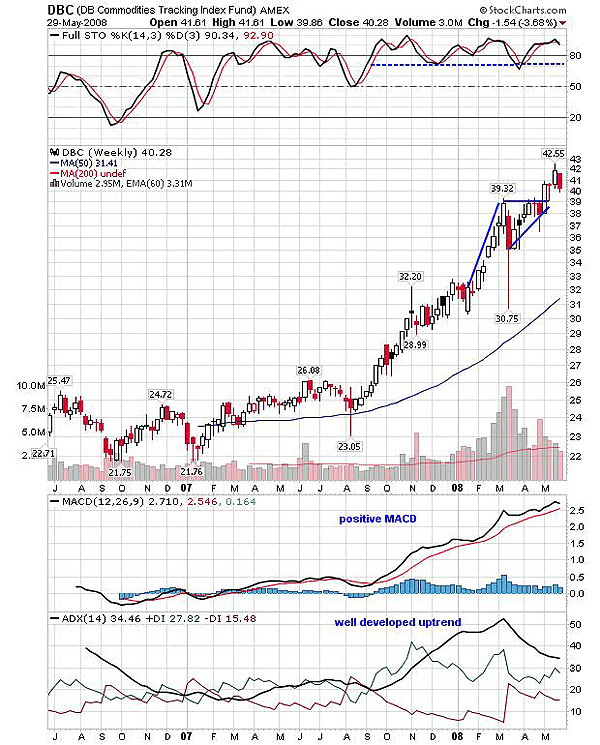
| FIGURE 2: DBC, WEEKLY. The indicators are highly bullish, so the price may pull back from the support of the flag & pennant pattern (39). |
| Graphic provided by: StockCharts.com. |
| |
| Figure 2, the weekly chart, gives us a clear picture of a flag & pennant formation. Earlier, the index was moving within the range of 24-41 for a considerable period, and as the upper range was violated, the DBC entered a fresh uptrend. The breakout dragged the index to new highs gradually, accumulating strength where necessary. Figure 2 also shows an increase in volume at every rising price level, along with highly bullish stochastic (14,3,3) that never drifted below the 70 level since 2007. The volume was highest at the 39 level and thereafter slowly declined as the stock entered consolidation. The breakout offers fresh buying opportunity. So far the big picture is very positive for the flag & pennant breakout and therefore can carry the index to an all-time high and closer to the target. The target could have been 39 - 32 = 7 + 39 (breakout level) = 46. |
| The index turned volatile at 42 that is its 52-week high and begun its downside journey. The stochastic (14,3,3) is in an overbought area but is declining. The blue annotated line shows the support for stochastic during the autumn. The MACD (12,26,9) is also in positive territory and ADX (14) also suggests a well-developed uptrend. Hence, the index has slipped from an all-time high, and the technical indicators are bullish, so traders need not worry. I would recommend booking profits at present levels, and reentering once the support of 39 held and a pullback is confirmed. |
Active trader in the Indian stock markets since 2003 and a full-time writer. Trading is largely based upon technical analysis.
| Company: | Independent |
| Address: | C1/3 Parth Indraprasth Towers. Vastrapur |
| Ahmedabad, Guj 380015 | |
| E-mail address: | chaitalimohile@yahoo.co.in |
Traders' Resource Links | |
| Independent has not added any product or service information to TRADERS' RESOURCE. | |
Click here for more information about our publications!
Comments
Date: 06/09/08Rank: 3Comment:

Request Information From Our Sponsors
- StockCharts.com, Inc.
- Candle Patterns
- Candlestick Charting Explained
- Intermarket Technical Analysis
- John Murphy on Chart Analysis
- John Murphy's Chart Pattern Recognition
- John Murphy's Market Message
- MurphyExplainsMarketAnalysis-Intermarket Analysis
- MurphyExplainsMarketAnalysis-Visual Analysis
- StockCharts.com
- Technical Analysis of the Financial Markets
- The Visual Investor
- VectorVest, Inc.
- Executive Premier Workshop
- One-Day Options Course
- OptionsPro
- Retirement Income Workshop
- Sure-Fire Trading Systems (VectorVest, Inc.)
- Trading as a Business Workshop
- VectorVest 7 EOD
- VectorVest 7 RealTime/IntraDay
- VectorVest AutoTester
- VectorVest Educational Services
- VectorVest OnLine
- VectorVest Options Analyzer
- VectorVest ProGraphics v6.0
- VectorVest ProTrader 7
- VectorVest RealTime Derby Tool
- VectorVest Simulator
- VectorVest Variator
- VectorVest Watchdog
