HOT TOPICS LIST
- MACD
- Fibonacci
- RSI
- Gann
- ADXR
- Stochastics
- Volume
- Triangles
- Futures
- Cycles
- Volatility
- ZIGZAG
- MESA
- Retracement
- Aroon
INDICATORS LIST
LIST OF TOPICS
PRINT THIS ARTICLE
by Mike Carr, CMT
With the Fed signaling that short-term rate cuts may have ended, the market is signaling that long-term rates are ready to rise.
Position: Buy
Mike Carr, CMT
Mike Carr, CMT, is a member of the Market Technicians Association, and editor of the MTA's newsletter, Technically Speaking. He is also the author of "Smarter Investing in Any Economy: The Definitive Guide to Relative Strength Investing," and "Conquering the Divide: How to Use Economic Indicators to Catch Stock Market Trends."
PRINT THIS ARTICLE
STRATEGIES
Interest Rates Heading Higher?
06/04/08 08:50:18 AMby Mike Carr, CMT
With the Fed signaling that short-term rate cuts may have ended, the market is signaling that long-term rates are ready to rise.
Position: Buy
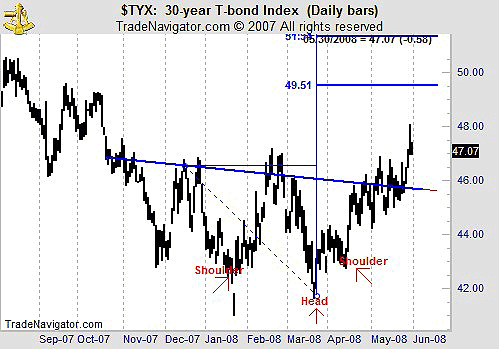
| In response to a weakening economy and turmoil in the credit markets, the Federal Reserve aggressively lowered interest rates and by many measures has flooded the market with cash. These steps to increase liquidity bring with them the possibility of higher inflation, and the Treasury market seems to be growing concerned about that possibility. If inflation goes up, the interest rate on long-term Treasuries should also go up. In Figure 1, we see that this interest rate is in fact going up. |

|
| FIGURE 1: 30-YEAR TREASURIES, DAILY. The daily chart of the yield on 30-year Treasuries shows that higher interest rates are likely. |
| Graphic provided by: Trade Navigator. |
| |
| After peaking in the middle of last year, the yield broke a longstanding down trendline in early May. Since then, the chart shows that an inverse head & shoulder pattern has been completed. The initial target from this formation is a yield of 4.95%, significantly above current levels near 4.71%. Determining chart patterns is more art than science, and many traders would argue that the head & shoulders in this formation are loosely defined. Those traders may see a triangle formation or perhaps a rectangular bottom. The important point is that these formations also are completed and call for higher prices, with the exact same initial target. |
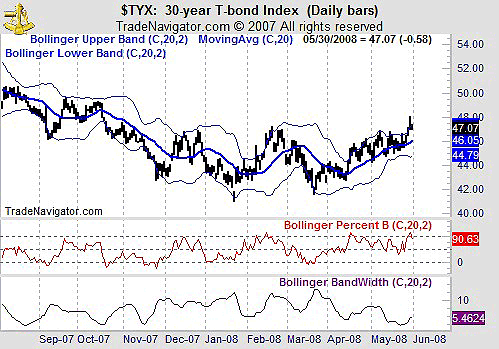
| In Figure 2, we see that Bollinger bands also argue for higher yields. Bollinger BandWidth is a proxy for volatility. Studies have shown that volatility is cyclical. From current low levels of volatility, we should expect to see larger moves in interest rates. We can also see that when the yield has gone beyond its upper band, it is just as likely to continue higher as lower. This behavior is typical in all tradables except stocks. |

|
| FIGURE 2: 30-YEAR TREASURY BONDS, DAILY. Volatility moves in cycles, and low volatility as we have now is followed by high volatility. |
| Graphic provided by: Trade Navigator. |
| |
| Traders looking for an increase in interest rates can buy mutual fund shares such as the Rydex Inverse High Yield Strategy (RYILX), which is inversely correlate to the performance of the high yield bond market. |
Mike Carr, CMT, is a member of the Market Technicians Association, and editor of the MTA's newsletter, Technically Speaking. He is also the author of "Smarter Investing in Any Economy: The Definitive Guide to Relative Strength Investing," and "Conquering the Divide: How to Use Economic Indicators to Catch Stock Market Trends."
| Website: | www.moneynews.com/blogs/MichaelCarr/id-73 |
| E-mail address: | marketstrategist@gmail.com |
Click here for more information about our publications!
Comments
Date: 06/04/08Rank: 4Comment:

Request Information From Our Sponsors
- StockCharts.com, Inc.
- Candle Patterns
- Candlestick Charting Explained
- Intermarket Technical Analysis
- John Murphy on Chart Analysis
- John Murphy's Chart Pattern Recognition
- John Murphy's Market Message
- MurphyExplainsMarketAnalysis-Intermarket Analysis
- MurphyExplainsMarketAnalysis-Visual Analysis
- StockCharts.com
- Technical Analysis of the Financial Markets
- The Visual Investor
- VectorVest, Inc.
- Executive Premier Workshop
- One-Day Options Course
- OptionsPro
- Retirement Income Workshop
- Sure-Fire Trading Systems (VectorVest, Inc.)
- Trading as a Business Workshop
- VectorVest 7 EOD
- VectorVest 7 RealTime/IntraDay
- VectorVest AutoTester
- VectorVest Educational Services
- VectorVest OnLine
- VectorVest Options Analyzer
- VectorVest ProGraphics v6.0
- VectorVest ProTrader 7
- VectorVest RealTime Derby Tool
- VectorVest Simulator
- VectorVest Variator
- VectorVest Watchdog
