HOT TOPICS LIST
- MACD
- Fibonacci
- RSI
- Gann
- ADXR
- Stochastics
- Volume
- Triangles
- Futures
- Cycles
- Volatility
- ZIGZAG
- MESA
- Retracement
- Aroon
INDICATORS LIST
LIST OF TOPICS
PRINT THIS ARTICLE
by Mike Carr, CMT
It is well known that small-cap stocks outperform large-caps over the long term. A recent analysis showed that mid-caps are actually the biggest long-term winners, and technicals support taking a position now.
Position: Buy
Mike Carr, CMT
Mike Carr, CMT, is a member of the Market Technicians Association, and editor of the MTA's newsletter, Technically Speaking. He is also the author of "Smarter Investing in Any Economy: The Definitive Guide to Relative Strength Investing," and "Conquering the Divide: How to Use Economic Indicators to Catch Stock Market Trends."
PRINT THIS ARTICLE
REL. STR COMPARATIVE
Surprising Research On Mid-Caps
06/02/08 01:33:51 PMby Mike Carr, CMT
It is well known that small-cap stocks outperform large-caps over the long term. A recent analysis showed that mid-caps are actually the biggest long-term winners, and technicals support taking a position now.
Position: Buy
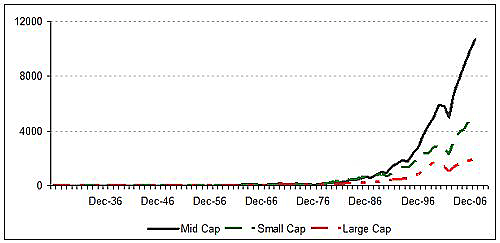
| Recent research by Ken Winans of Winans International revealed that mid-cap stocks are the best performers going back to 1927. Through 2007, this asset class would have delivered a total return of 1,071,395%, more than doubling the returns available through small-cap or large-cap stocks (Figure 1). This dramatic outperformance was also demonstrated in the time period from 1958 through 2007, as mid-cap stocks also beat the returns available from global stocks over that span. |

|
| FIGURE 1: MID-CAPS. Over a 70-year period, mid-caps delivered higher returns with less volatility than other stock capitalization groups. |
| Graphic provided by: Winans International. |
| |
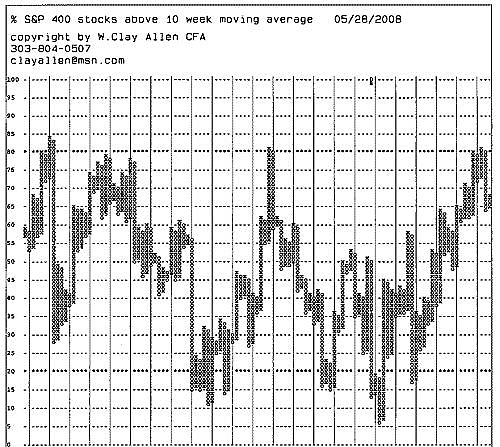
| Many traders focus on large-cap or small-cap stocks. Looking deeper at the Standard & Poor's 400, we can see that the current market environment seems to be favoring mid-cap stocks (Figure 2). This chart shows the percentage of stocks within that index trading above their 10-week moving average. Using a point & figure format highlights the trend, which is currently up. Levels of 80% and 20% area are associated with overbought and oversold extremes. As Figure 2 shows, these stocks have not become overbought since the rally began in March 2008. |

|
| FIGURE 2: S&P 400. Breadth charts shown in point & figure format make it easy to spot the trend in the stock market. In this case, the S&P 400 looks like a strong buy. |
| Graphic provided by: Market Dynamics. |
| |
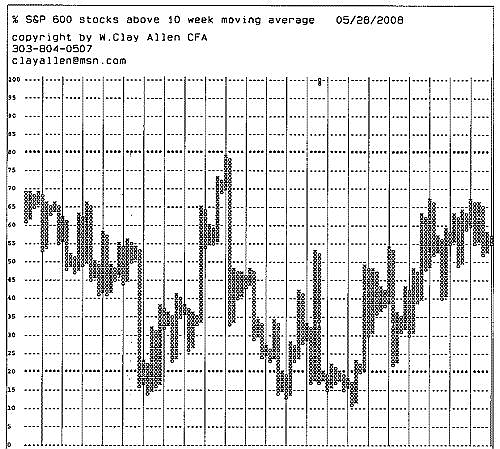
| In contrast, Figure 3 shows the percentage of small-cap stocks trading above their 10-week moving average. This chart still shows an upward trend, but it is significantly less bullish than the chart of the mid-caps. In the current environment, history seems to be repeating itself as mid-cap stocks outpace small-caps. The breadth of large-cap stocks looks similar to Figure 3. |

|
| FIGURE 3: S&P 600. Small-cap stocks, represented here as the S&P 600, have lagged mid-caps since the March lows in the market. |
| Graphic provided by: Market Dynamics. |
| |
| Traders looking at this idea can use the iShares S&P MidCap 400 Index (IJH) as a trading vehicle. A simple strategy would be to buy breakouts in breadth after the number of stocks trading above their 10-week moving average falls below 20%. Sells can be taken on a triple bottom point & figure signal. |
Mike Carr, CMT, is a member of the Market Technicians Association, and editor of the MTA's newsletter, Technically Speaking. He is also the author of "Smarter Investing in Any Economy: The Definitive Guide to Relative Strength Investing," and "Conquering the Divide: How to Use Economic Indicators to Catch Stock Market Trends."
| Website: | www.moneynews.com/blogs/MichaelCarr/id-73 |
| E-mail address: | marketstrategist@gmail.com |
Click here for more information about our publications!
Comments

Request Information From Our Sponsors
- StockCharts.com, Inc.
- Candle Patterns
- Candlestick Charting Explained
- Intermarket Technical Analysis
- John Murphy on Chart Analysis
- John Murphy's Chart Pattern Recognition
- John Murphy's Market Message
- MurphyExplainsMarketAnalysis-Intermarket Analysis
- MurphyExplainsMarketAnalysis-Visual Analysis
- StockCharts.com
- Technical Analysis of the Financial Markets
- The Visual Investor
- VectorVest, Inc.
- Executive Premier Workshop
- One-Day Options Course
- OptionsPro
- Retirement Income Workshop
- Sure-Fire Trading Systems (VectorVest, Inc.)
- Trading as a Business Workshop
- VectorVest 7 EOD
- VectorVest 7 RealTime/IntraDay
- VectorVest AutoTester
- VectorVest Educational Services
- VectorVest OnLine
- VectorVest Options Analyzer
- VectorVest ProGraphics v6.0
- VectorVest ProTrader 7
- VectorVest RealTime Derby Tool
- VectorVest Simulator
- VectorVest Variator
- VectorVest Watchdog
