

HOT TOPICS LIST
- MACD
- Fibonacci
- RSI
- Gann
- ADXR
- Stochastics
- Volume
- Triangles
- Futures
- Cycles
- Volatility
- ZIGZAG
- MESA
- Retracement
- Aroon
INDICATORS LIST
LIST OF TOPICS
PRINT THIS ARTICLE
by Arthur Hill
After failing at a key resistance point, the Dow Jones Industrial Average broke a key support level to reverse an uptrend that started in mid-March.
Position: Sell
Arthur Hill
Arthur Hill is currently editor of TDTrader.com, a website specializing in trading strategies, sector/industry specific breadth stats and overall technical analysis. He passed the Society of Technical Analysts (STA London) diploma exam with distinction is a Certified Financial Technician (CFTe). Prior to TD Trader, he was the Chief Technical Analyst for Stockcharts.com and the main contributor to the ChartSchool.
PRINT THIS ARTICLE
MACD
A Breakdown For The Dow
05/30/08 09:11:38 AMby Arthur Hill
After failing at a key resistance point, the Dow Jones Industrial Average broke a key support level to reverse an uptrend that started in mid-March.
Position: Sell
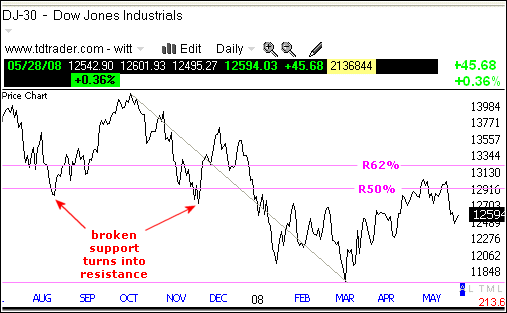
| Figure 1 shows closing prices to filter out some of the noise from the spike lows in January and March. The Dow Jones Industrial Average (DJIA) declined from October 2007 to March 2008 and then bounced back to broken support in May. Even though the DJIA overshot the August–November lows (~12,800), it met resistance around 13,100 twice in May. Using zones and allowing for a little leeway, we can assume that broken support zones turned into a resistance zone. |
|
| FIGURE 1: DJIA, DAILY. Here are closing prices to filter out some of the noise from the spike lows in January and March. |
| Graphic provided by: TeleChart2007. |
| |
| Resistance around 13,000 is confirmed by two key retracements. The DJIA became oversold after the October 2007–March 2008 decline and the March–May rally alleviated these oversold conditions. In addition, a corrective advance typically retraces 50–62% of the prior decline (pink lines). The DJIA moved into this zone in early May and met resistance twice. |
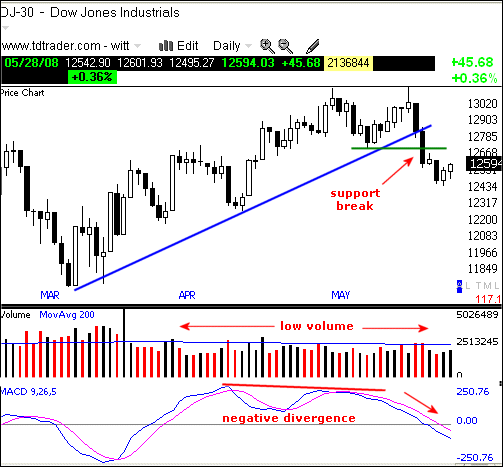
| Figure 2 focuses on the May highs and the recent breakdown. The DJIA established support with the May 9th low around 12,700. With a sharp decline from resistance, the DJIA broke the March trendline and forged a lower low. This break was quite clean and reverses the uptrend that had been in force since March. After all, downtrends start with lower lows. |
|
| FIGURE 2: DJIA, DAILY. Note the May highs and the recent breakdown. |
| Graphic provided by: TeleChart2007. |
| |
| Momentum confirms weakness as the moving average convergence/divergence (MACD) turns bearish. MACD formed a negative divergence from April to May and moved into negative territory in late May. The signal line crossover in early May provided the first bearish signal. With a move into negative territory, MACD and momentum clearly favor the bears. |
Arthur Hill is currently editor of TDTrader.com, a website specializing in trading strategies, sector/industry specific breadth stats and overall technical analysis. He passed the Society of Technical Analysts (STA London) diploma exam with distinction is a Certified Financial Technician (CFTe). Prior to TD Trader, he was the Chief Technical Analyst for Stockcharts.com and the main contributor to the ChartSchool.
| Title: | Editor |
| Company: | TDTrader.com |
| Address: | Willem Geetsstraat 17 |
| Mechelen, B2800 | |
| Phone # for sales: | 3215345465 |
| Website: | www.tdtrader.com |
| E-mail address: | arthurh@tdtrader.com |
Traders' Resource Links | |
| TDTrader.com has not added any product or service information to TRADERS' RESOURCE. | |
Click here for more information about our publications!
Comments
Date:�06/03/08Rank:�5Comment:�

Request Information From Our Sponsors
- VectorVest, Inc.
- Executive Premier Workshop
- One-Day Options Course
- OptionsPro
- Retirement Income Workshop
- Sure-Fire Trading Systems (VectorVest, Inc.)
- Trading as a Business Workshop
- VectorVest 7 EOD
- VectorVest 7 RealTime/IntraDay
- VectorVest AutoTester
- VectorVest Educational Services
- VectorVest OnLine
- VectorVest Options Analyzer
- VectorVest ProGraphics v6.0
- VectorVest ProTrader 7
- VectorVest RealTime Derby Tool
- VectorVest Simulator
- VectorVest Variator
- VectorVest Watchdog
- StockCharts.com, Inc.
- Candle Patterns
- Candlestick Charting Explained
- Intermarket Technical Analysis
- John Murphy on Chart Analysis
- John Murphy's Chart Pattern Recognition
- John Murphy's Market Message
- MurphyExplainsMarketAnalysis-Intermarket Analysis
- MurphyExplainsMarketAnalysis-Visual Analysis
- StockCharts.com
- Technical Analysis of the Financial Markets
- The Visual Investor