HOT TOPICS LIST
- MACD
- Fibonacci
- RSI
- Gann
- ADXR
- Stochastics
- Volume
- Triangles
- Futures
- Cycles
- Volatility
- ZIGZAG
- MESA
- Retracement
- Aroon
INDICATORS LIST
LIST OF TOPICS
PRINT THIS ARTICLE
by Chaitali Mohile
NASDAQ 100 formed a strong round bottom and the breakout has retraced to the previous support. The index is ready to begin its upward journey soon.
Position: Buy
Chaitali Mohile
Active trader in the Indian stock markets since 2003 and a full-time writer. Trading is largely based upon technical analysis.
PRINT THIS ARTICLE
ROUND TOP & BOTTOM
$NDX Resumes Bullish Path
06/05/08 01:23:02 PMby Chaitali Mohile
NASDAQ 100 formed a strong round bottom and the breakout has retraced to the previous support. The index is ready to begin its upward journey soon.
Position: Buy
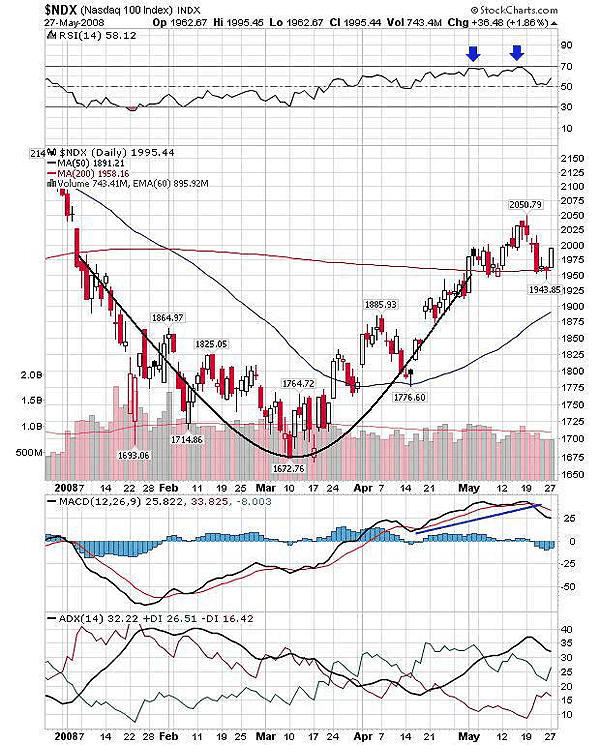
| A round bottom is a strong bottom formation and suggests a reversal trend of an existing downtrend. The pattern breakout is confirmed once the price moves above the moving average. The breakout brings in a fresh bullish rally, but traders should remember that the breakout level is likely to get tested again as the price may come back before moving further. The duration of pattern may vary from a few weeks to years; the larger the pattern, the more significant is the breakout. In Figure 1, the NASDAQ 100 enters into a downtrend in January 2008 on violating the strongest support of the 200-day moving average. The series of lower lows followed thereafter, and soon the index was at its lowest level of 1672.76, though the journey was highly volatile. Meanwhile, the short-term moving average (50-day) that moved below the 200-day moving average (MA) had a deep U-turn. |

|
| FIGURE 1: $NDX, DAILY. By the time the round bottom broke out, the RSI (14) was rallying in between the 50 and 70 levels. See how the price retraced back on the same support level of 200-day MA and the RSI (14) is also resting on the golden support of 50. |
| Graphic provided by: StockCharts.com. |
| |
| Eventually, the price begins to move in the direction of the 50-day MA and toward the 200-day MA resistance. The volume went down, though it didn't fall dramatically due to uncertainty and fear among the traders. The price movement regained its bullish strength as the 50-day MA resistance was violated and the relative strength index (RSI)(14) also ran above the 50 level and continued. The bullish journey gradually reduced the selling pressure, according to average directional movement index (ADX) (14) and the downtrend slowly turned up. As the 200-day MA resistance was hit, volume increased in anticipation of a breakout and the bullish reversal pattern formation. The entire movement had formed a rounded bottom and the stronger base for the breakout was expected to happen. This breakout would attract fresh buying in the index and the individual stocks as well. |
| The moving average convergence/divergence (MACD) (12,26,9) is comfortable in positive territory, supporting the breakout to surge to new highs. This was the first buying opportunity for traders and the index had a robust 100-point move. Thereafter, the index turned back to the support zone of the 200-day MA. All three indicators are still very bullish, which means the index could move to the previous high and above. The ADX (14) indicates a developing uptrend after declining marginally, so the index is ready to resume its upward journey soon with stronger bullish strength. |
Active trader in the Indian stock markets since 2003 and a full-time writer. Trading is largely based upon technical analysis.
| Company: | Independent |
| Address: | C1/3 Parth Indraprasth Towers. Vastrapur |
| Ahmedabad, Guj 380015 | |
| E-mail address: | chaitalimohile@yahoo.co.in |
Traders' Resource Links | |
| Independent has not added any product or service information to TRADERS' RESOURCE. | |
Click here for more information about our publications!
Comments
Date: 06/09/08Rank: 3Comment:

Request Information From Our Sponsors
- StockCharts.com, Inc.
- Candle Patterns
- Candlestick Charting Explained
- Intermarket Technical Analysis
- John Murphy on Chart Analysis
- John Murphy's Chart Pattern Recognition
- John Murphy's Market Message
- MurphyExplainsMarketAnalysis-Intermarket Analysis
- MurphyExplainsMarketAnalysis-Visual Analysis
- StockCharts.com
- Technical Analysis of the Financial Markets
- The Visual Investor
- VectorVest, Inc.
- Executive Premier Workshop
- One-Day Options Course
- OptionsPro
- Retirement Income Workshop
- Sure-Fire Trading Systems (VectorVest, Inc.)
- Trading as a Business Workshop
- VectorVest 7 EOD
- VectorVest 7 RealTime/IntraDay
- VectorVest AutoTester
- VectorVest Educational Services
- VectorVest OnLine
- VectorVest Options Analyzer
- VectorVest ProGraphics v6.0
- VectorVest ProTrader 7
- VectorVest RealTime Derby Tool
- VectorVest Simulator
- VectorVest Variator
- VectorVest Watchdog
