HOT TOPICS LIST
- MACD
- Fibonacci
- RSI
- Gann
- ADXR
- Stochastics
- Volume
- Triangles
- Futures
- Cycles
- Volatility
- ZIGZAG
- MESA
- Retracement
- Aroon
INDICATORS LIST
LIST OF TOPICS
PRINT THIS ARTICLE
by Chaitali Mohile
Entire gains of the early trading hours vanished by end of the day, and the Dow Jones Transportation Average may move flat further to the lower support.
Position: N/A
Chaitali Mohile
Active trader in the Indian stock markets since 2003 and a full-time writer. Trading is largely based upon technical analysis.
PRINT THIS ARTICLE
CANDLESTICK CHARTING
$TRAN Sees Huge Selloff
06/04/08 08:50:42 AMby Chaitali Mohile
Entire gains of the early trading hours vanished by end of the day, and the Dow Jones Transportation Average may move flat further to the lower support.
Position: N/A
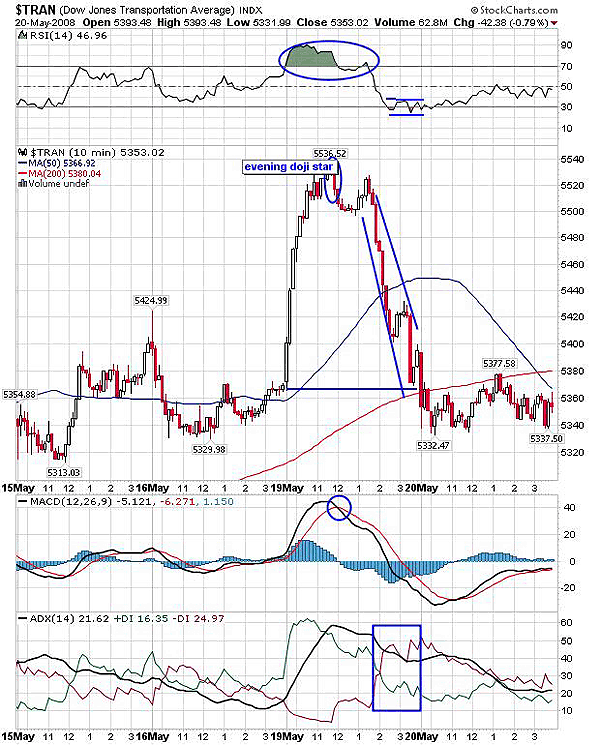
| The day began on highly bullish notes after a few days of a consolidated move. The trading session on May 19 showed robust strength in early trading hours, carrying the average approximately 225 points higher from the support level at 5375. According to Figure 1, May 15 and 16 were normal consolidation days with convincing bullish views by relative strength index (RSI) (14) and moving average convergence/divergence (MACD) (12,26,9). Accordingly, the strong breakout was witness on May 19, accumulating the trader's confidence. The RSI (14) moved vertically from 50 to the overbought area as the price moved higher and higher. In addition, the MACD (12,26,9) was positive. So the situation was favorable for the breakout to move ahead. |
| But the RSI (14) at overbought levels seemed slippery. The price movement signaled the reversal as the evening doji star was formed at the new high of the day. This reversal candlestick pattern put an end to the upward rally and indicated a fresh fall. $TRAN still tried to recover those few lost points, but the RSI (14) failed to show bullish strength. In addition, the MACD (12,26,9) had a bearish crossover weakening the transportation average. The selling pressure turned serious and the gains vanished in the last two hours of the trading session. The stock was back to the previous low at one movement but recovered marginally as the day ended. This showed the power of reversal candlestick pattern. |

|
| FIGURE 1: $TRAN, 10-MINUTE. With an evening doji star and overbought RSI (14), the $TRAN plunged hard and the entire bullish rally was back to an intraday low. |
| Graphic provided by: StockCharts.com. |
| |
| The evening doji star is a bearish reversal pattern. It always appears in an uptrend and turns an existing trend to a bearish favor. The doji shows indecision amid the traders to continue the bullish rally ahead. The bears get the advantage here and come in with pressure. The highly overbought RSI (14) also declined steeply to oversold areas near 30 levels. Above all, the MACD (12,26,9) plunged to negative territory with no signs of recovery. So the entire gains of the day were taken off as the session closed. |

|
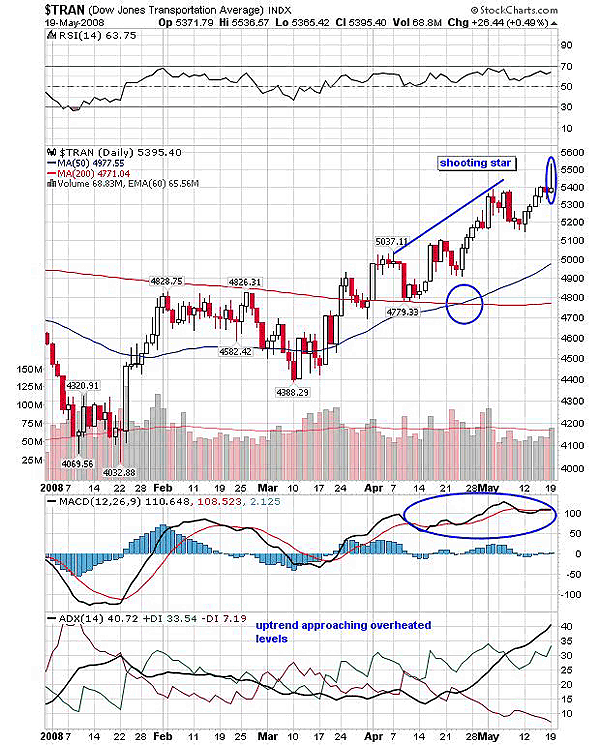
| FIGURE 2: $TRAN, DAILY. The uptrend has reached overheated levels and RSI (14) was unable to move above 70 levels. In addition, due to the shooting star, the transportation average was likely to retrace to a prior low of 5200. |
| Graphic provided by: StockCharts.com. |
| |
| The 10-minute chart was just a glimpse of intraday business, but the real picture of the next trading session was seen on the daily chart. The intraday price movement of this particular trading session formed a second strong bearish reversal pattern, which was more alarming. The shooting star was formed at the top, leaving the traders stunned. Figure 2 shows that the stock was in a strong uptrend since March 2008, and the price thus formed higher highs and higher lows. $TRAN was moving in an upward channel along with strong bullish indicators. At the 5400 level, the rally stalled and some correction poured in. But undergoing a correction or consolidation after the prolonged advance rally can be a healthy sign for bullish traders. On the same note, the $TRAN recovered but by now, 5400 turned out to be a psychological resistance for traders on board. And the intraday selling pressure formed a shooting star, which was a warning to traders. |
| The average directional movement index (ADX) (14) too moved closer to overheated levels of 40, which again pointed to a trend reversal. Sometimes, the ADX (14) does extend to higher overheated levels like 50, 60, but here the indicators showed possibility of a decline. So there are two bearish signals now, a shooting star and an overheated ADX (14). So the selling off is likely to head to further weakness at least for a few trading sessions. The earlier support level of 5200 may get tested with this move. |
Active trader in the Indian stock markets since 2003 and a full-time writer. Trading is largely based upon technical analysis.
| Company: | Independent |
| Address: | C1/3 Parth Indraprasth Towers. Vastrapur |
| Ahmedabad, Guj 380015 | |
| E-mail address: | chaitalimohile@yahoo.co.in |
Traders' Resource Links | |
| Independent has not added any product or service information to TRADERS' RESOURCE. | |
Click here for more information about our publications!
PRINT THIS ARTICLE

Request Information From Our Sponsors
- StockCharts.com, Inc.
- Candle Patterns
- Candlestick Charting Explained
- Intermarket Technical Analysis
- John Murphy on Chart Analysis
- John Murphy's Chart Pattern Recognition
- John Murphy's Market Message
- MurphyExplainsMarketAnalysis-Intermarket Analysis
- MurphyExplainsMarketAnalysis-Visual Analysis
- StockCharts.com
- Technical Analysis of the Financial Markets
- The Visual Investor
- VectorVest, Inc.
- Executive Premier Workshop
- One-Day Options Course
- OptionsPro
- Retirement Income Workshop
- Sure-Fire Trading Systems (VectorVest, Inc.)
- Trading as a Business Workshop
- VectorVest 7 EOD
- VectorVest 7 RealTime/IntraDay
- VectorVest AutoTester
- VectorVest Educational Services
- VectorVest OnLine
- VectorVest Options Analyzer
- VectorVest ProGraphics v6.0
- VectorVest ProTrader 7
- VectorVest RealTime Derby Tool
- VectorVest Simulator
- VectorVest Variator
- VectorVest Watchdog
