HOT TOPICS LIST
- MACD
- Fibonacci
- RSI
- Gann
- ADXR
- Stochastics
- Volume
- Triangles
- Futures
- Cycles
- Volatility
- ZIGZAG
- MESA
- Retracement
- Aroon
INDICATORS LIST
LIST OF TOPICS
PRINT THIS ARTICLE
by Mike Carr, CMT
With major averages facing resistance at their 200-day moving averages, we test the reliability of this indicator.
Position: N/A
Mike Carr, CMT
Mike Carr, CMT, is a member of the Market Technicians Association, and editor of the MTA's newsletter, Technically Speaking. He is also the author of "Smarter Investing in Any Economy: The Definitive Guide to Relative Strength Investing," and "Conquering the Divide: How to Use Economic Indicators to Catch Stock Market Trends."
PRINT THIS ARTICLE
MOVING AVERAGES
Is The 200-Day Moving Average A Reliable Trend Indicator?
05/28/08 09:03:46 AMby Mike Carr, CMT
With major averages facing resistance at their 200-day moving averages, we test the reliability of this indicator.
Position: N/A
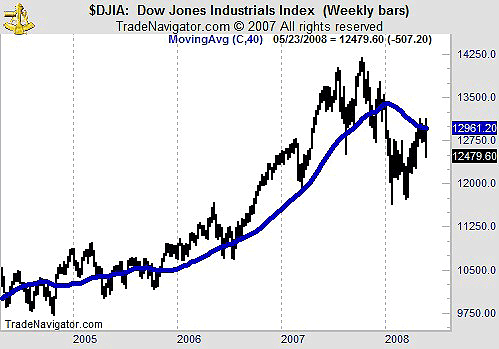
| Nearly all major stock market averages are approaching what is widely believed to be a significant technical level. In Figure 1, we show the Dow Jones Industrial Average (DJIA) with its 40-week moving average. This is approximately the same as a 200-day moving average, but we selected the weekly view in order to fit more data into the chart. While we are highlighting the DJIA in Figure 1, other major averages such as the NASDAQ Composite, Standard & Poor's 500, or any of the Russell indexes are in the same position relative to this moving average. |

|
| FIGURE 1: DJIA, WEEKLY. The DJIA is just below its 40-week simple moving average. |
| Graphic provided by: Trade Navigator. |
| |
| It can easily be seen in the chart that this moving average captures large portions of the trends. This is the appeal for commentators who can quickly point to the buy signal in mid-2006 that led to a gain of nearly 2,000 DJIA points over the next year. What can also be seen in Figure 1 is that there appear to be a lot of whipsaws associated with this strategy. |
| Whipsaws are trades where price initially moves in one direction but quickly reverses. The result is usually a series of small losses. Moving average signals are notorious for creating whipsaws, which makes it difficult for traders to use these systems. |
| Testing crossovers of the 200-day moving average as a buy signal yields disappointing results. In the DJIA dating back to 1900, there have been 185 long trades, but only 15.1% were profitable. Overall, the trader would show a small profit after nearly 108 years, but the maximum drawdown of 3,277 DJIA points exceeds gains of only 2,147 points. Results are even worse in the S&P 500, which shows only 8.3% of signals would have been winners since 1950. Signals in the NASDAQ Composite were correct about 36% of the time since 1985. |
| The problem with these crossover signals is the large number of whipsaw trades, often four or five small losers before the trend fully develops. While commentators will tout the 200-day moving average as reliable, traders are well advised to avoid acting on this news. |
Mike Carr, CMT, is a member of the Market Technicians Association, and editor of the MTA's newsletter, Technically Speaking. He is also the author of "Smarter Investing in Any Economy: The Definitive Guide to Relative Strength Investing," and "Conquering the Divide: How to Use Economic Indicators to Catch Stock Market Trends."
| Website: | www.moneynews.com/blogs/MichaelCarr/id-73 |
| E-mail address: | marketstrategist@gmail.com |
Click here for more information about our publications!
Comments
Date: 05/28/08Rank: 3Comment:
Date: 09/10/15Rank: 4Comment:

Request Information From Our Sponsors
- VectorVest, Inc.
- Executive Premier Workshop
- One-Day Options Course
- OptionsPro
- Retirement Income Workshop
- Sure-Fire Trading Systems (VectorVest, Inc.)
- Trading as a Business Workshop
- VectorVest 7 EOD
- VectorVest 7 RealTime/IntraDay
- VectorVest AutoTester
- VectorVest Educational Services
- VectorVest OnLine
- VectorVest Options Analyzer
- VectorVest ProGraphics v6.0
- VectorVest ProTrader 7
- VectorVest RealTime Derby Tool
- VectorVest Simulator
- VectorVest Variator
- VectorVest Watchdog
- StockCharts.com, Inc.
- Candle Patterns
- Candlestick Charting Explained
- Intermarket Technical Analysis
- John Murphy on Chart Analysis
- John Murphy's Chart Pattern Recognition
- John Murphy's Market Message
- MurphyExplainsMarketAnalysis-Intermarket Analysis
- MurphyExplainsMarketAnalysis-Visual Analysis
- StockCharts.com
- Technical Analysis of the Financial Markets
- The Visual Investor
