HOT TOPICS LIST
- MACD
- Fibonacci
- RSI
- Gann
- ADXR
- Stochastics
- Volume
- Triangles
- Futures
- Cycles
- Volatility
- ZIGZAG
- MESA
- Retracement
- Aroon
INDICATORS LIST
LIST OF TOPICS
PRINT THIS ARTICLE
by Mike Carr, CMT
The market is caught between Fibonacci support and resistance levels, with bulls and bears battling for control.
Position: N/A
Mike Carr, CMT
Mike Carr, CMT, is a member of the Market Technicians Association, and editor of the MTA's newsletter, Technically Speaking. He is also the author of "Smarter Investing in Any Economy: The Definitive Guide to Relative Strength Investing," and "Conquering the Divide: How to Use Economic Indicators to Catch Stock Market Trends."
PRINT THIS ARTICLE
FIBONACCI
Fibonacci Levels Show S&P 500 At A Turning Point
05/23/08 10:20:03 AMby Mike Carr, CMT
The market is caught between Fibonacci support and resistance levels, with bulls and bears battling for control.
Position: N/A
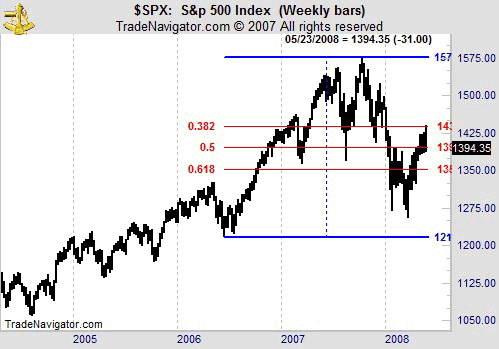
| The Standard & Poor's 500 gained nearly 30% from its 2006 lows during a 16-month advance. The weekly chart (Figure 1) shows that prices are facing potential resistance after reaching a Fibonacci level associated with that move. The decline from the October 2007 high retraced more than 61.8% of the prior advance, a potentially bearish development. Since that March 2008 low, prices have moved higher, to the 38.2% retracement level. Moving higher from here is bullish, while failing to penetrate this resistance would be a bad sign for the bulls. |

|
| FIGURE 1: $SPX, WEEKLY. The weekly chart of the S&P 500 with Fibonacci levels highlights the resistance the index is facing. |
| Graphic provided by: Trade Navigator. |
| |
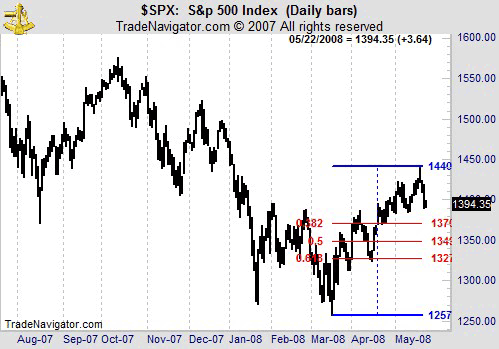
| The daily chart of the S&P 500 in Figure 2 puts the recent declines into context. Although sudden, the down move has so far failed to retrace even 38.2% of the prior up move. At this level, it should be considered as nothing more than a mild correction. |

|
| FIGURE 2: $SPX, DAILY. The daily chart of the S&P 500 offers the bulls reason for optimism. |
| Graphic provided by: Trade Navigator. |
| |
| The longer-term direction will be easy to spot. A break above 1440 will indicate a push toward 1500 is very likely. A break below 1370 is bearish. These prices are fairly distant from the current price. |
| How does this help a trader to take action? Those currently invested have some critical support and resistance levels to monitor as a signal that the market has resolved the short-term trading range. Investors trading with an intermediate-term time frame can wait for price to break out before initiating new positions. Very aggressive traders can employ more margin when the breakout occurs. For any trading style, these levels can help you develop trading tactics. |
Mike Carr, CMT, is a member of the Market Technicians Association, and editor of the MTA's newsletter, Technically Speaking. He is also the author of "Smarter Investing in Any Economy: The Definitive Guide to Relative Strength Investing," and "Conquering the Divide: How to Use Economic Indicators to Catch Stock Market Trends."
| Website: | www.moneynews.com/blogs/MichaelCarr/id-73 |
| E-mail address: | marketstrategist@gmail.com |
Click here for more information about our publications!
Comments
Date: 05/27/08Rank: 4Comment:

Request Information From Our Sponsors
- StockCharts.com, Inc.
- Candle Patterns
- Candlestick Charting Explained
- Intermarket Technical Analysis
- John Murphy on Chart Analysis
- John Murphy's Chart Pattern Recognition
- John Murphy's Market Message
- MurphyExplainsMarketAnalysis-Intermarket Analysis
- MurphyExplainsMarketAnalysis-Visual Analysis
- StockCharts.com
- Technical Analysis of the Financial Markets
- The Visual Investor
- VectorVest, Inc.
- Executive Premier Workshop
- One-Day Options Course
- OptionsPro
- Retirement Income Workshop
- Sure-Fire Trading Systems (VectorVest, Inc.)
- Trading as a Business Workshop
- VectorVest 7 EOD
- VectorVest 7 RealTime/IntraDay
- VectorVest AutoTester
- VectorVest Educational Services
- VectorVest OnLine
- VectorVest Options Analyzer
- VectorVest ProGraphics v6.0
- VectorVest ProTrader 7
- VectorVest RealTime Derby Tool
- VectorVest Simulator
- VectorVest Variator
- VectorVest Watchdog
