HOT TOPICS LIST
- MACD
- Fibonacci
- RSI
- Gann
- ADXR
- Stochastics
- Volume
- Triangles
- Futures
- Cycles
- Volatility
- ZIGZAG
- MESA
- Retracement
- Aroon
INDICATORS LIST
LIST OF TOPICS
PRINT THIS ARTICLE
by Koos van der Merwe
Sangoma is the South African term for a witch doctor. In this falling market, is the company living up to its name?
Position: Accumulate
Koos van der Merwe
Has been a technical analyst since 1969, and has worked as a futures and options trader with First Financial Futures in Johannesburg, South Africa.
PRINT THIS ARTICLE
TRIANGLES
What Is Sangoma's Chart Telling Us?
05/22/08 12:55:00 PMby Koos van der Merwe
Sangoma is the South African term for a witch doctor. In this falling market, is the company living up to its name?
Position: Accumulate
| Sangoma's telephony and data hardware and software empower your personal computer to deliver superior auditory quality when communicating with public telephone networks. |
| The company has had its trials since going public on the Vancouver BC stock exchange. The share was pitched at $1.00, rose quickly to $1.30, but then fell when the technology bubble burst in 2000 to a low of $0.15 by October 2004. Since then, and after a change in CEOs, the company has lifted itself from the doldrums, exceeded its initial offering price of $1, and now, it looks as if new highs could be within reach. |

|
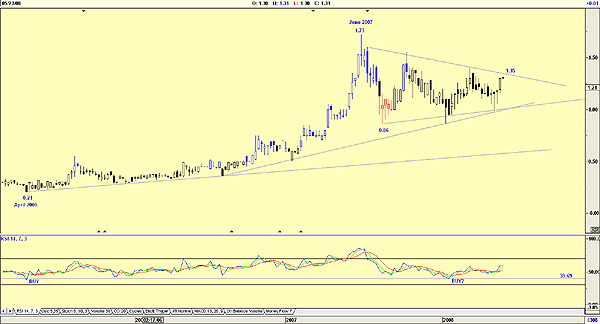
| FIGURE 1: SANGOMA, WEEKLY. This chart shows the consolidation triangle. |
| Graphic provided by: AdvancedGET. |
| |
| Figure 1 is a weekly chart and shows how the price has moved from a low of $0.21 in April 2005 to a high of $1.73 by June 2007. Since that date, the share price has moved into what appears to be a consolidation triangle, with a breakout level of $1.35. Should this occur, then we could expect a target of $2.38. (1.73 - 0.21 = 1.52 + 0.86 = 2.38). The negative to the breakout is the relative strength index (RSI), which has not fallen below the 30 level. The usual levels are oversold at below 30 and overbought above 70. In this instance, the share price has fallen to 39.69. This is the level reached when the share price started rising in 2005, as shown on the chart. |

|
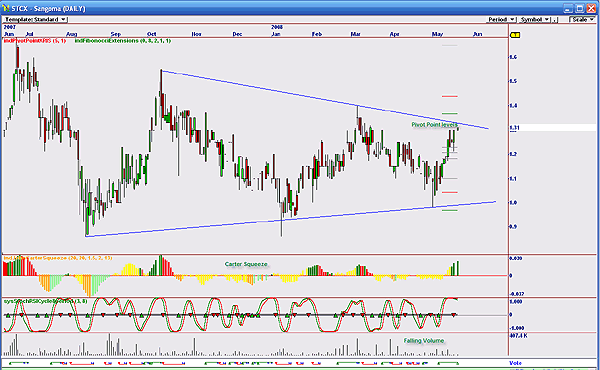
| FIGURE 2: SANGOMA, DAILY. This chart suggests a correction. |
| Graphic provided by: Omnitrader. |
| |
| Figure 2 is a daily chart that suggests that the share price should not penetrate the trendline. The reasons are as follow: a. There is resistance at the trendline shown on the chart. This is supported by: b. The share price is also testing a pivot point level c. The Carter squeeze indicator, which is suggesting a sell signal d. The stochastic RSI, which is overbought and turning down e. Volume, which has fallen as the share price has risen f. The voting signal. This signal gave a buy on May 6. The consolidation triangle shown is suggesting that a good profit can be made by owning shares in the company. Buying at present levels, however, is unwise, and we could wait for a correction downward until the indicators suggest a more buyable level. In the meantime, we could accumulate slowly on any and every correction. |
Has been a technical analyst since 1969, and has worked as a futures and options trader with First Financial Futures in Johannesburg, South Africa.
| Address: | 3256 West 24th Ave |
| Vancouver, BC | |
| Phone # for sales: | 6042634214 |
| E-mail address: | petroosp@gmail.com |
Click here for more information about our publications!
Comments
Date: 05/27/08Rank: 4Comment:

Request Information From Our Sponsors
- StockCharts.com, Inc.
- Candle Patterns
- Candlestick Charting Explained
- Intermarket Technical Analysis
- John Murphy on Chart Analysis
- John Murphy's Chart Pattern Recognition
- John Murphy's Market Message
- MurphyExplainsMarketAnalysis-Intermarket Analysis
- MurphyExplainsMarketAnalysis-Visual Analysis
- StockCharts.com
- Technical Analysis of the Financial Markets
- The Visual Investor
- VectorVest, Inc.
- Executive Premier Workshop
- One-Day Options Course
- OptionsPro
- Retirement Income Workshop
- Sure-Fire Trading Systems (VectorVest, Inc.)
- Trading as a Business Workshop
- VectorVest 7 EOD
- VectorVest 7 RealTime/IntraDay
- VectorVest AutoTester
- VectorVest Educational Services
- VectorVest OnLine
- VectorVest Options Analyzer
- VectorVest ProGraphics v6.0
- VectorVest ProTrader 7
- VectorVest RealTime Derby Tool
- VectorVest Simulator
- VectorVest Variator
- VectorVest Watchdog
