HOT TOPICS LIST
- MACD
- Fibonacci
- RSI
- Gann
- ADXR
- Stochastics
- Volume
- Triangles
- Futures
- Cycles
- Volatility
- ZIGZAG
- MESA
- Retracement
- Aroon
INDICATORS LIST
LIST OF TOPICS
PRINT THIS ARTICLE
by Chaitali Mohile
XLE shows the bullish symptoms to continue the upward rally by entering the new uptrend with a gap-up breakout.
Position: Buy
Chaitali Mohile
Active trader in the Indian stock markets since 2003 and a full-time writer. Trading is largely based upon technical analysis.
PRINT THIS ARTICLE
BREAKOUTS
Energy Select Sector Has Robust Breakout
06/04/08 08:07:29 AMby Chaitali Mohile
XLE shows the bullish symptoms to continue the upward rally by entering the new uptrend with a gap-up breakout.
Position: Buy
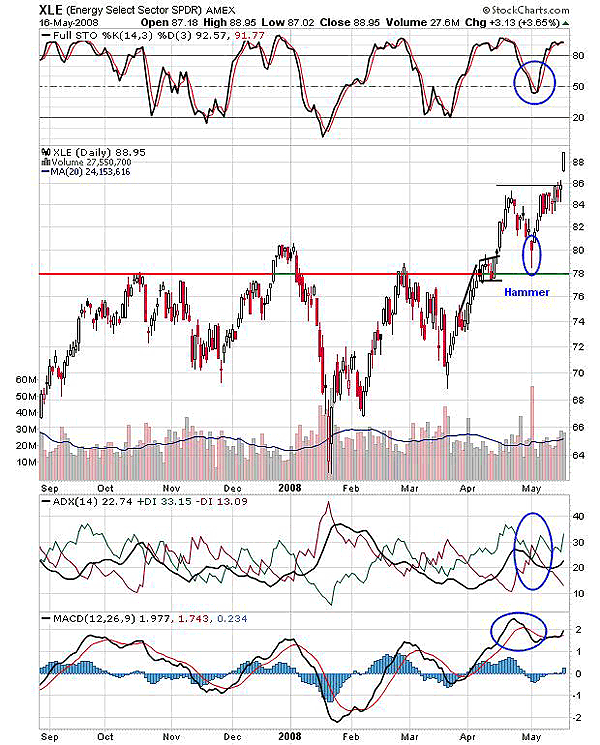
| For XLE, the 78 level has been a very crucial support-resistance zone, with various upside rallies since September 2007 turning down after hitting this area. In Figure 1, the red & green indicate the resistance & support levels, respectively. The rally with the support of 70 in mid-March was an exception, as it consolidated near 78 instead of retracing back like previous moves. The consolidation formed a flag & pennant continuation pattern, which broke off in an upward direction and soon reached its targeted level (78 - 74 = 4 + 80 = 84). This breakout converted the 78 resistance to stronger support now. The moving average convergence/divergence (MACD) shifted in positive territory while the buying pressure also increased in a trend indicator. The trend gradually turned bullish as suggested by average directional movement index (ADX) (14). So even though the stochastic (14,3,3) was highly overbought, the bullish notes were robust, carrying the move ahead. |

|
| FIGURE 1: XLE, DAILY. The red and green indicate the resistance & support levels, respectively. |
| Graphic provided by: StockCharts.com. |
| |
| On this note, the stochastic (14,3,3) established support at 50 and turned upward for the next bullish run. Meanwhile, the price also retraced to the prior support-resistance zone (78). Along with indicators turning bullish, the price chart too showed the end of an earlier downward rally by forming a hammer candlestick pattern perfectly on the support of 78. This added bullish strength to the rally and to the confidence of traders. This helped the rally surge to higher goals, but price movement witnessed some volatility as it moved closer to the previous high of 84. Traders can watch the MACD (12,26,9), the shaky moves near trigger line and selling pressure increased marginally indicated by negative directional index (-DI) in ADX (14). |
| The gap-up breakout refreshed the bullish rally that was getting exhausted under the pressure. XLE is therefore ready to continue its present bullish journey with the target than can be measured with the length of the previous rally from 78 to 86. The length is 8 (86 - 78) so by adding to 87, we get the target of 95. The ADX (14) is indicating a developing uptrend above 20, and MACD (12,26,9) is equally positive toward the bullish rally. So overbought stochastic (14,3,3) may not damage the rally as the other two indicators have a bullish signal to continue the rally. Traders can enter the trade at a current level as the gap up is not high. The stop-loss can be observed at 85 in anticipation of a gap getting filled immediately. |

|
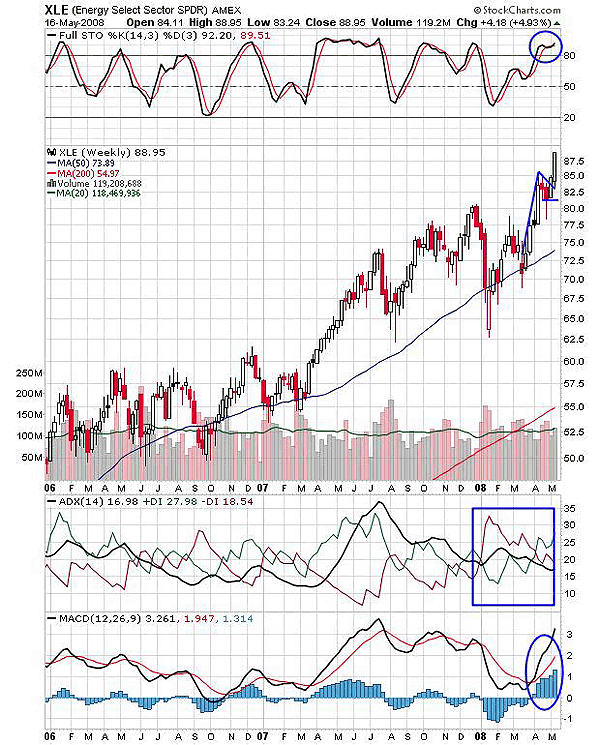
| FIGURE 2: XLE, WEEKLY. XLE consolidated in a narrow range of 85 and 82.5 after a long advance rally of almost 10 points. |
| Graphic provided by: StockCharts.com. |
| |
| On the weekly chart (Figure 2), XLE consolidated in a narrow range of 85 and 82.5 after a long advance rally of almost 10 points. For XLE, every upward move is followed by a marginal correction that strengthen the sector at different levels. Now the gap-up breakout resulted in a flag & pennant breakout on a weekly basis. The 10-point advance rally followed by a narrow range consolidation formed this bullish continuation pattern. Stochastic (14,3,3) at 89 level suggests more space for breakout rally, and also, MACD (12,26,9) is highly positive to carry the sector toward its new target. For long-term traders and investors, the target here would be the length of the flag pole plus a breakout level. Therefore, the length is 10, and added to 85 (breakout level), we get the target of 95. |
| Thus, with a gap-up breakout, the sector can be a good trading opportunity for traders and investors. The uptrend developing, the rally is likely to sustain its bullishness. |
Active trader in the Indian stock markets since 2003 and a full-time writer. Trading is largely based upon technical analysis.
| Company: | Independent |
| Address: | C1/3 Parth Indraprasth Towers. Vastrapur |
| Ahmedabad, Guj 380015 | |
| E-mail address: | chaitalimohile@yahoo.co.in |
Traders' Resource Links | |
| Independent has not added any product or service information to TRADERS' RESOURCE. | |
Click here for more information about our publications!
Comments
Date: 06/04/08Rank: 2Comment:

Request Information From Our Sponsors
- StockCharts.com, Inc.
- Candle Patterns
- Candlestick Charting Explained
- Intermarket Technical Analysis
- John Murphy on Chart Analysis
- John Murphy's Chart Pattern Recognition
- John Murphy's Market Message
- MurphyExplainsMarketAnalysis-Intermarket Analysis
- MurphyExplainsMarketAnalysis-Visual Analysis
- StockCharts.com
- Technical Analysis of the Financial Markets
- The Visual Investor
- VectorVest, Inc.
- Executive Premier Workshop
- One-Day Options Course
- OptionsPro
- Retirement Income Workshop
- Sure-Fire Trading Systems (VectorVest, Inc.)
- Trading as a Business Workshop
- VectorVest 7 EOD
- VectorVest 7 RealTime/IntraDay
- VectorVest AutoTester
- VectorVest Educational Services
- VectorVest OnLine
- VectorVest Options Analyzer
- VectorVest ProGraphics v6.0
- VectorVest ProTrader 7
- VectorVest RealTime Derby Tool
- VectorVest Simulator
- VectorVest Variator
- VectorVest Watchdog
