HOT TOPICS LIST
- MACD
- Fibonacci
- RSI
- Gann
- ADXR
- Stochastics
- Volume
- Triangles
- Futures
- Cycles
- Volatility
- ZIGZAG
- MESA
- Retracement
- Aroon
INDICATORS LIST
LIST OF TOPICS
PRINT THIS ARTICLE
by Ron Walker
The intraday 60-minute chart on the S&P 500 has developed a bullish inverse head & shoulders pattern, while its daily chart has formed a bearish rising wedge. Moreover, the daily chart is in an uphill battle as it approaches the 200-day simple moving average and Fibonacci retracements. Which pattern will prevail? Support and resistance may hold the key.
Position: N/A
Ron Walker
Ron Walker is an active trader and technical analyst. He operates an educational website dedicated to the study of Technical Analysis. The website offers free market analysis with daily video presentations and written commentaries. Ron is a video pioneer, being one of the first to utilize the internet producing Technical Analysis videos. His website is thechartpatterntrader.com
PRINT THIS ARTICLE
Conflicting Signs On The S&P 500
05/23/08 01:21:37 PMby Ron Walker
The intraday 60-minute chart on the S&P 500 has developed a bullish inverse head & shoulders pattern, while its daily chart has formed a bearish rising wedge. Moreover, the daily chart is in an uphill battle as it approaches the 200-day simple moving average and Fibonacci retracements. Which pattern will prevail? Support and resistance may hold the key.
Position: N/A
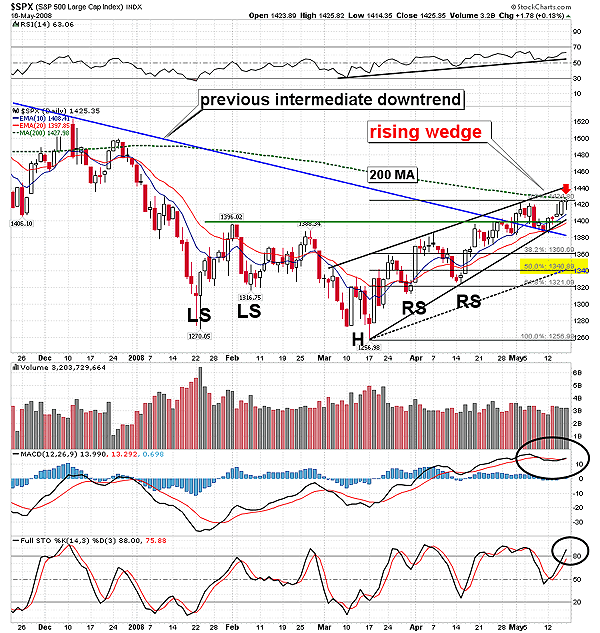
| The last time I wrote about the Standard & Poor's 500, it was forming the handle on an inverse complex head & shoulders pattern. Since that time, the S&P 500 moved above the handle and broke above its intermediate downtrend (Figure 1). After a very powerful breakout that lifted prices toward the 200-day simple moving average (SMA), the bulls took a breather while the S&P 500 moved back to test the broken trendline. Prices successfully bounced off the trendline, as support was found at the 20-day exponential moving average (EMA). At that time, the relative strength index (RSI) (14) held above the support level of 50, indicating a reduction in bearish sentiment. This is now the third touch of the rising trendline off the March low. If the S&P 500 can produce a definitive break above the last high of 1423 without the trendline being breached, it will be classified as an intermediate trendline. |

|
| FIGURE 1: $SPX, DAILY. With the S&P 500 approaching resistance at the 200-day SMA, a narrow range has developed, with resistance at 1427 and support at the rising trendline near the 1405 area. A rising wedge pattern on the S&P 500 may play out if prices fail to conquer the 200-day SMA. |
| Graphic provided by: StockCharts.com. |
| |
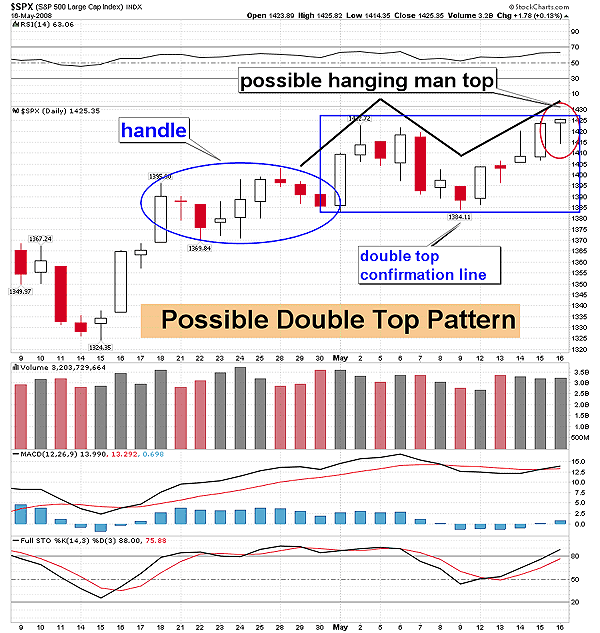
| After prices bounced off the downward trendline, the S&P 500 attempted to test the 200-day SMA once again, but the rally seemed uncertain as a hanging man candlestick appeared on May 16. In addition, a rising wedge has formed from the March lows, which could bring about some bearish ramifications. A hanging man candlestick will be confirmed if prices close below the long tail underneath the real body of the candlestick. The S&P 500 has been stuck in a trading range ever since prices broke the downward trend in late April, with support at 1383 and resistance near 1423 area. On May 16 prices did manage to move above 1423, but only by 2 points with a close of 1425. The hanging man candlestick could be setting up a possible short-term double-top pattern near the mid-1420 area (Figure 2). The confirmation line would be 1383, the pattern measures 42 points with a target of 1341. That is the 50% Fibonacci retracement from the March 17th low. And if you were to draw a parallel line that mirrors rising resistance (the upper boundary), taking from the March low, it points to the 1341 area (Figure 2). So that is a area of interest, should this rally falter. But keep in mind that before the confirmation line can be violated, the rising trendline must break near the 1405 area. |

|
| FIGURE 2: $SPX, DAILY. With prices in a trading range, another possible pattern has emerged, a double top. If prices can break above the mid-1420 area, the bulls will continue their reign over the market. But if the 1383 area is violated, it will help the bears regain their footing. |
| Graphic provided by: StockCharts.com. |
| |
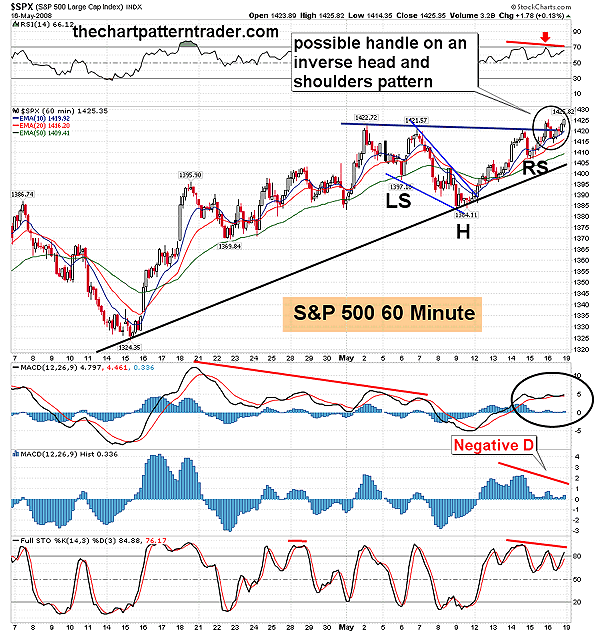
| In contrast to the daily chart's bearish overtones, the S&P's 60-minute chart (Figure 3) reveals that there is an inverse head & shoulders pattern that has developed since the beginning of May. Currently, there is a handle forming on that pattern. This pattern measures 40 points, from the high of 1423 to the low of 1383. The target is found by taking the difference and adding it to the tallest point on the pattern. That gives a objective target of 1463. If the pattern is obtained, prices will have successfully risen above the 200-day SMA. Further, the 10-, 20-, and 50-period EMAs remain bullish, while they are pointing upward with no signs of a bearish crossover. But the histogram (12,26, 9) now has negative divergence, which could hinder the bulls. |

|
| FIGURE 3: $SPX, 60-MINUTE. The 60-minute chart has developed an inverse head & shoulders pattern, but negative divergence is looming over the hourly chart. Currently, a handle is being carved out. If prices break down, watch the rising trendline at 1405. |
| Graphic provided by: StockCharts.com. |
| |
| The S&P 500 is also coming very close to the 61.8% Fibonacci from its October high. Its weekly chart adds to the massive amount of resistance at these levels, as it is approaching overhead resistance near the 1435 area, from the August and November closing lows. The S&P 500 is overdue for a correction, but until the rising trendline on the daily chart is violated, the bulls remain in power. However, should the moving average convergence/divergence (MACD) (12,26, 9) in the daily time frame get a lower peak than its last peak, negative divergence could set in. The same is true for the RSI in that same time frame. That could eventually allow the rising wedge to play out, increasing bearish forces in the form of a contratrend. |
| If a corrective move did take place at these levels, I think prices would recover, ultimately reaching the daily chart's inverse complex head & shoulders pattern target of 1536. No one has been more bullish than I have been, but now that we are running into some major resistance, a defensive posture should be taken. But until the rising trendline on the daily chart is broken, the bulls remain in power, and we may witness the head & shoulder pattern on the 60-minute obtaining its target of 1463. Nevertheless, the volatility index (VIX) is reaching levels of complacency, with its lowest readings since October. This should be regarded as a short-term negative signal, allowing the rising wedge to break down. |
Ron Walker is an active trader and technical analyst. He operates an educational website dedicated to the study of Technical Analysis. The website offers free market analysis with daily video presentations and written commentaries. Ron is a video pioneer, being one of the first to utilize the internet producing Technical Analysis videos. His website is thechartpatterntrader.com
| Website: | thechartpatterntrader.com |
| E-mail address: | thechartpatterntrader@gmail.com |
Click here for more information about our publications!
Comments
Date: 05/24/08Rank: 5Comment:
Date: 05/27/08Rank: 4Comment:

Request Information From Our Sponsors
- StockCharts.com, Inc.
- Candle Patterns
- Candlestick Charting Explained
- Intermarket Technical Analysis
- John Murphy on Chart Analysis
- John Murphy's Chart Pattern Recognition
- John Murphy's Market Message
- MurphyExplainsMarketAnalysis-Intermarket Analysis
- MurphyExplainsMarketAnalysis-Visual Analysis
- StockCharts.com
- Technical Analysis of the Financial Markets
- The Visual Investor
- VectorVest, Inc.
- Executive Premier Workshop
- One-Day Options Course
- OptionsPro
- Retirement Income Workshop
- Sure-Fire Trading Systems (VectorVest, Inc.)
- Trading as a Business Workshop
- VectorVest 7 EOD
- VectorVest 7 RealTime/IntraDay
- VectorVest AutoTester
- VectorVest Educational Services
- VectorVest OnLine
- VectorVest Options Analyzer
- VectorVest ProGraphics v6.0
- VectorVest ProTrader 7
- VectorVest RealTime Derby Tool
- VectorVest Simulator
- VectorVest Variator
- VectorVest Watchdog
