HOT TOPICS LIST
- MACD
- Fibonacci
- RSI
- Gann
- ADXR
- Stochastics
- Volume
- Triangles
- Futures
- Cycles
- Volatility
- ZIGZAG
- MESA
- Retracement
- Aroon
INDICATORS LIST
LIST OF TOPICS
PRINT THIS ARTICLE
by Alan R. Northam
Support and resistance lines not only help traders in identifying areas of support and resistance, but they can be used to determine the trend of the market.
Position: N/A
Alan R. Northam
Alan Northam lives in the Dallas, Texas area and as an electronic engineer gave him an analytical mind from which he has developed a thorough knowledge of stock market technical analysis. His abilities to analyze the future direction of the stock market has allowed him to successfully trade of his own portfolio over the last 30 years. Mr. Northam is now retired and trading the stock market full time. You can reach him at inquiry@tradersclassroom.com or by visiting his website at http://www.tradersclassroom.com. You can also follow him on Twitter @TradersClassrm.
PRINT THIS ARTICLE
SUPPORT & RESISTANCE
Support And Resistance Lines Define Market Trends
05/15/08 02:06:48 PMby Alan R. Northam
Support and resistance lines not only help traders in identifying areas of support and resistance, but they can be used to determine the trend of the market.
Position: N/A
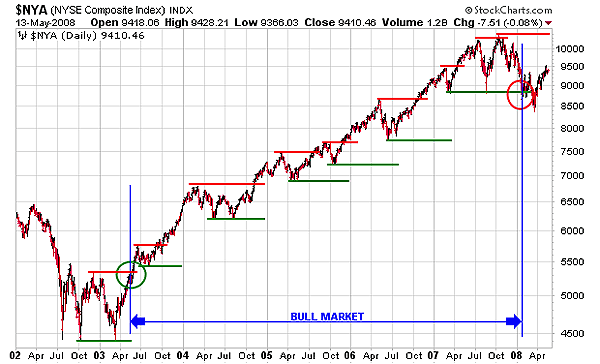
| Support and resistance lines can be used to define market trends. Figure 1 below shows the daily price bars of the Composite Index of the New York Stock Exchange from 2002 to 2008 to date along with the support and resistance lines. Bull and bear markets do not rise or fall in straight lines. Bull markets rise in waves and bear markets fall in waves. In Figure 1, the peak of each wave is marked by a horizontal red line and the bottom of each wave is marked by a horizontal green line. As you can see from 2003 to 2008, the NYSE rose from approximately 4500 to 10000 in a series of waves. The peak of each wave represents an area of resistance where the market could not move higher and the red horizontal line is known as a resistance line. The bottom of each wave represents an area of support where the market refused to move lower and the green horizontal line is known as a support line. In a bull market, note that each support line is higher than the next and that the market never trades lower than the previous support line. In addition, each resistance line is higher than the next but also note that the market eventually trades higher than the previous resistance line. Technicians say that the line or resistance is broken when the market trades through it. In a bull market, resistance lines are easily broken, whereas support lines are never broken. This rule is the key to identifying bull markets using support and resistance lines. |

|
| FIGURE 1: $NYA, DAILY. The daily price chart of the New York Composite Index shows the bull market between 2003 and 2008 along with support and resistance lines. |
| Graphic provided by: StockCharts.com. |
| |
| It is also possible to tell when the bull market is coming to an end by using support and resistance lines. I'd like to draw your attention to the middle of 2007. Note here that the market came down and traded right down to the support line that was drawn in early 2007. Also note that this is the first time the market traded down to a previous support line since the bull market started in 2003. This is the first sign that the bull market is tiring as it could not make a higher low where a new higher support line could be drawn. Further, note that the last resistance line drawn off the market peak in October 2007 was just barely higher than the previous resistance line. Again, this is a sign that the bull market is weakening as the peak in early October 2007 was just barely higher than the peak in early July 2007. The bull market then came to an end when the market traded below the support line drawn off the early 2007 wave bottom, or market low. I have identified this point with a red circle. |
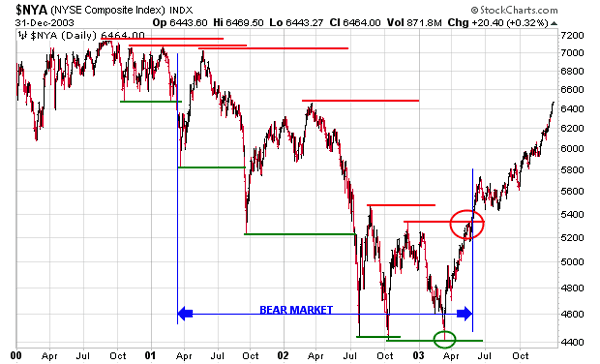
| Figure 2 shows the daily price bars of the Composite Index of the New York Stock Exchange from 2000 to 2003 to date along with the support and resistance lines. Again in Figure 2 the peak of each wave is marked by a horizontal red line and the bottom of each wave is marked by a horizontal green line. As you can see, from 2000 to 2003 the New York Stock Exchange fell from approximately 7000 to 4400 in a series of waves. In a bear market, each resistance line is lower than the next and the market never trades higher than the previous resistance line. In addition, each support line is lower than the next and the market eventually trades lower than the previous support line. Technicians say that a line or support is broken when the market trades through it. In a bear market, support lines are easily broken whereas resistance lines are never broken. This rule is the key to identifying bear markets using support and resistance lines. |

|
| FIGURE 2: $NYA, DAILY. The daily price chart of the New York Composite Index shows the bear market between 2000 and 2003 along with support and resistance lines. |
| Graphic provided by: StockCharts.com. |
| |
| It is also possible to tell when the bear market is coming to an end by using support and resistance lines. I'd like to draw your attention to the middle of 2002. Note that the market came down and traded just slightly below the support line that was drawn off the July 2002 low. This new low provided a new area of support just below the previous area of support. This was the first clue that the bear market was losing its strength. Now see what happened in early 2003. Here the market traded down to the last support line drawn but did not break through it. This became the second clue that the bear market was coming to an end. After the market failed to break below this line of support, the market then started to trade higher and eventually broke through the resistance line drawn off the late 2002 high. This was the first time that a resistance line was broken since the beginning of the bear market in early 2001. With the market failing to break below support in early 2003 and the market breaking above the resistance drawn off the market peak in late 2002, the bear market came to an end. |
| In conclusion, bull and bear markets can be defined by support and resistance lines. In a bull market, support lines are never broken, whereas resistance lines are easily broken. When the resistance line fails to be broken and the support line is easily broken, it is a sign that the bull market is coming to an end. In a bear market, just the opposite is true. In a bear market, resistance lines are never broken and support lines are easily broken. When support lines fail to be broken and the resistance line is easily broken, it is a sign that the bear market is coming to an end. However, I must flash a warning sign at this juncture. There will be times when using support and resistance lines to determine the market trend where a false signal will be given. When this happens, the market can continue in the direction of the major trend after giving a sign that the trend is coming to an end. In these cases, the second sign that the trend is coming to an end will usually be the correct signal, and in some rare cases a technician might even have to wait for a third sign. One final comment. Looking back at Figure 1, see that the bull market came to an end right at the beginning of 2008. Use the rule of defining a bear market with support and resistance lines to determine if a new bear market is under way. |
Alan Northam lives in the Dallas, Texas area and as an electronic engineer gave him an analytical mind from which he has developed a thorough knowledge of stock market technical analysis. His abilities to analyze the future direction of the stock market has allowed him to successfully trade of his own portfolio over the last 30 years. Mr. Northam is now retired and trading the stock market full time. You can reach him at inquiry@tradersclassroom.com or by visiting his website at http://www.tradersclassroom.com. You can also follow him on Twitter @TradersClassrm.
| Garland, Tx | |
| Website: | www.tradersclassroom.com |
| E-mail address: | inquiry@tradersclassroom.com |
Click here for more information about our publications!
Comments

|

Request Information From Our Sponsors
- StockCharts.com, Inc.
- Candle Patterns
- Candlestick Charting Explained
- Intermarket Technical Analysis
- John Murphy on Chart Analysis
- John Murphy's Chart Pattern Recognition
- John Murphy's Market Message
- MurphyExplainsMarketAnalysis-Intermarket Analysis
- MurphyExplainsMarketAnalysis-Visual Analysis
- StockCharts.com
- Technical Analysis of the Financial Markets
- The Visual Investor
- VectorVest, Inc.
- Executive Premier Workshop
- One-Day Options Course
- OptionsPro
- Retirement Income Workshop
- Sure-Fire Trading Systems (VectorVest, Inc.)
- Trading as a Business Workshop
- VectorVest 7 EOD
- VectorVest 7 RealTime/IntraDay
- VectorVest AutoTester
- VectorVest Educational Services
- VectorVest OnLine
- VectorVest Options Analyzer
- VectorVest ProGraphics v6.0
- VectorVest ProTrader 7
- VectorVest RealTime Derby Tool
- VectorVest Simulator
- VectorVest Variator
- VectorVest Watchdog
