HOT TOPICS LIST
- MACD
- Fibonacci
- RSI
- Gann
- ADXR
- Stochastics
- Volume
- Triangles
- Futures
- Cycles
- Volatility
- ZIGZAG
- MESA
- Retracement
- Aroon
INDICATORS LIST
LIST OF TOPICS
PRINT THIS ARTICLE
by Mike Carr, CMT
This classic pattern reliably offers defined risk and profitable opportunities.
Position: Buy
Mike Carr, CMT
Mike Carr, CMT, is a member of the Market Technicians Association, and editor of the MTA's newsletter, Technically Speaking. He is also the author of "Smarter Investing in Any Economy: The Definitive Guide to Relative Strength Investing," and "Conquering the Divide: How to Use Economic Indicators to Catch Stock Market Trends."
PRINT THIS ARTICLE
HEAD & SHOULDERS
Terex: An Inverted Head & Shoulders
05/15/08 11:04:13 AMby Mike Carr, CMT
This classic pattern reliably offers defined risk and profitable opportunities.
Position: Buy
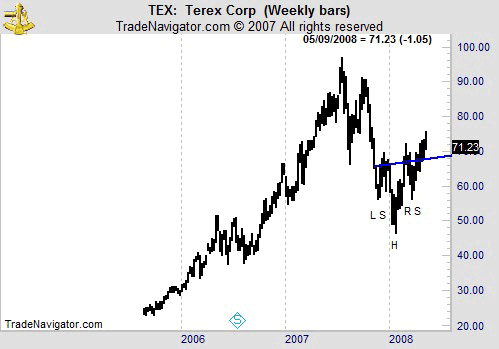
| The inverted head & shoulders pattern has been tested by well-known chartist Thomas N. Bulkowski and the results are presented in his comprehensive reference book, Encyclopedia Of Chart Patterns. He finds this pattern meets the measured price objective 74% of the time. This pattern is formed when prices fall to a new low and then rise slightly before resuming the downtrend. This new decline forms a lower low, and then prices rise again to the area of the previous up move. After that, the price falls again, to about the level seen in the initial decline. From here, prices move higher through the neckline formed by connecting the earlier advances. |
| An example can be seen in the weekly chart of Terex (TEX)(Figure 1). The measured move from the double-top pattern has been achieved and the stock has been moving higher. Prices recently broke through the neckline and consolidated at that level. At this point, the stock looks like it is ready to deliver a 30% gain based upon the projections from the inverted head & shoulders pattern. |

|
| FIGURE 1: TEX, WEEKLY. Relying solely on pattern analysis, this chart of TEX is bullish. |
| Graphic provided by: Trade Navigator. |
| |
| The fact that the height of the pattern can be used to project the gains make this trading strategy especially appealing. In this case, we can ignore less profitable opportunities to pursue what would be a very nice trading profit. Another useful feature of chart analysis is that they can be used to quantitatively define risk. If the price of TEX falls below the neckline, we should close the trade and take the small loss. For TEX, that represents a price of 68, a risk of about 5%, for a reward-to-risk ratio of 6-to-1. |
| Bulkowski notes that performance of this pattern improves if the pattern occurs within a third of the yearly high when compared to forming near the 52-week low. TEX meets that criterion, enhancing the odds that this will be a profitable trade. |
Mike Carr, CMT, is a member of the Market Technicians Association, and editor of the MTA's newsletter, Technically Speaking. He is also the author of "Smarter Investing in Any Economy: The Definitive Guide to Relative Strength Investing," and "Conquering the Divide: How to Use Economic Indicators to Catch Stock Market Trends."
| Website: | www.moneynews.com/blogs/MichaelCarr/id-73 |
| E-mail address: | marketstrategist@gmail.com |
Click here for more information about our publications!
Comments
Date: 05/16/08Rank: 5Comment:

Request Information From Our Sponsors
- StockCharts.com, Inc.
- Candle Patterns
- Candlestick Charting Explained
- Intermarket Technical Analysis
- John Murphy on Chart Analysis
- John Murphy's Chart Pattern Recognition
- John Murphy's Market Message
- MurphyExplainsMarketAnalysis-Intermarket Analysis
- MurphyExplainsMarketAnalysis-Visual Analysis
- StockCharts.com
- Technical Analysis of the Financial Markets
- The Visual Investor
- VectorVest, Inc.
- Executive Premier Workshop
- One-Day Options Course
- OptionsPro
- Retirement Income Workshop
- Sure-Fire Trading Systems (VectorVest, Inc.)
- Trading as a Business Workshop
- VectorVest 7 EOD
- VectorVest 7 RealTime/IntraDay
- VectorVest AutoTester
- VectorVest Educational Services
- VectorVest OnLine
- VectorVest Options Analyzer
- VectorVest ProGraphics v6.0
- VectorVest ProTrader 7
- VectorVest RealTime Derby Tool
- VectorVest Simulator
- VectorVest Variator
- VectorVest Watchdog
