HOT TOPICS LIST
- MACD
- Fibonacci
- RSI
- Gann
- ADXR
- Stochastics
- Volume
- Triangles
- Futures
- Cycles
- Volatility
- ZIGZAG
- MESA
- Retracement
- Aroon
INDICATORS LIST
LIST OF TOPICS
PRINT THIS ARTICLE
by Paolo Pezzutti
The giant retailer beats analysts' sales expectations in April.
Position: Accumulate
Paolo Pezzutti
Author of the book "Trading the US Markets - A Comprehensive Guide to US Markets for International Traders and Investors" - Harriman House (July 2008)
PRINT THIS ARTICLE
TECHNICAL ANALYSIS
Wal-Mart: A Cure For Recession
05/14/08 02:46:35 PMby Paolo Pezzutti
The giant retailer beats analysts' sales expectations in April.
Position: Accumulate
| Wal-Mart Stores Inc. (WMT) reported its total sales rose 3.8% in April, beating the estimates. Despite tough competition and the US economic situation, the company continues to provide value to customers for the price they pay. Consumers facing four consecutive months of hard times headed for Wal-Mart instead of malls. Wal-Mart peers such as Costco, BJ's, or Marshalls also did well. What can we expect in the next months? Shoppers are heading to discount retailers. This is going to continue in the near future as the economy continues to be weak, although May sales are already expected to drop. In the past two years, the stock has slightly outperformed the Consumer Staples SPDR (XLP) going up 21% vs. 16%. If you look at only a one-year time frame, you can see that shares went up almost 20% vs. 2% of the SPDR. In fact, this last year, WMT has done very well, printing a steep uptrend that started in November 2007. |

|
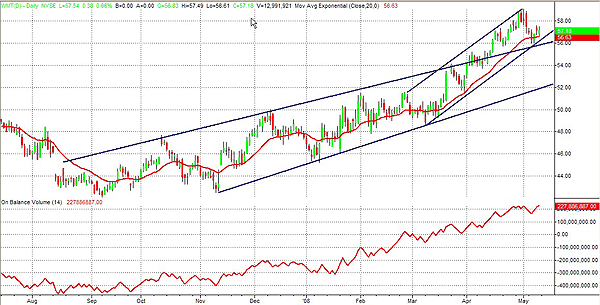
| FIGURE 1: WMT, DAILY. The uptrend has accelerated in the past months. The stock has been constantly accumulated. |
| Graphic provided by: TradeStation. |
| |
| In the daily chart in Figure 1, you can see that the price last autumn started to form an up channel from the lows at about $42 printed in September and November. What is more impressive is that with the stock market performing quite poorly during the first months of 2008, the WMT uptrend accelerated and formed a more inclined channel to the upside, breaking out the upper trendline. In this time frame, prices are on short-term supports. In the figure you can also see the on-balance volume indicator. Since October 2007, WMT has been constantly accumulated. As you may know, this indicator sets up two categories: up volume and down volume. When prices close lower one day than they closed the day before, the volume is considered down volume and assigned a negative value. When prices close higher than they closed the day before, the volume of that day is considered up volume and assigned a positive value. OBV is a running total of down volume and up volume. Divergences between price and the on-balance volume may contribute to the indication that something is changing in the underlying trend. Between April 30 and May 2, WMT printed a bearish candlestick formation with a top at $59 and has initiated a pullback toward the lower trendline. Prices may now attempt to retest this resistance. Support is at $56. |

|
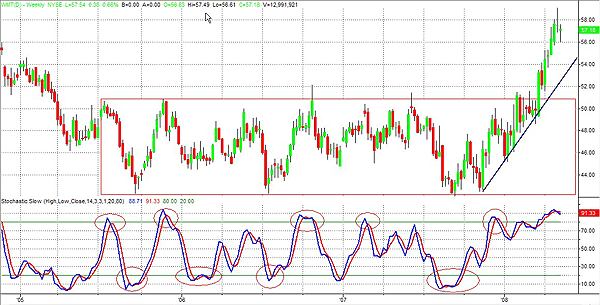
| FIGURE 2: WMT, WEEKLY. The stock managed to break out from a long rectangle developed since 2005. During the long sideways move, oscillators have provided good indications. |
| Graphic provided by: TradeStation. |
| |
| In Figure 2, the weekly chart displays the very long rectangle that was developed between 2005 and March 2008 with a base at $43 and an upper level at $53. After such a long time, the breakout has been explosive. In a sideways environment, a simple oscillator like the stochastic, which compares where a security's price closed relative to its price range over a given time period, would have provided good indications on average. The last two weeks have developed a candlestick pattern that may indicate a pause in the uptrend. The $59 level is now a resistance. |

|
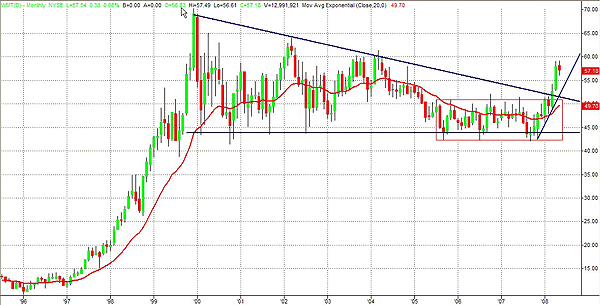
| FIGURE 3: WMT, MONTHLY. After a very long consolidation developed in the form of a triangle, the breakout to the upside may push prices to retest the previous highs. |
| Graphic provided by: TradeStation. |
| |
| In Figure 3, the monthly chart displays how prices managed to break out to the upside from the long triangle that developed since 2000. This triangle may be seen as a consolidation after the impressive uptrend printed from 1997 to 2000. Provided that false breakouts are possible and therefore a stop level has to be always in place, I would say that it is likely to see WMT retest the $65-70 level in the longer term. |
| It is important, given the positive big picture, to try to spot a lower-risk entry point in the shorter time frames. This is because you do not want to chase prices when they go up, only to remain trapped after a few sessions. In this case, WMT has already been in an uptrend for some months, even accelerating lately. As there are some signs of a slowdown and resistance in the up move, I would wait for a correction, should it ever occur. In my opinion, buying now does not present a good risk-reward situation, although the overall assessment of the long-term trend is promising. |
Author of the book "Trading the US Markets - A Comprehensive Guide to US Markets for International Traders and Investors" - Harriman House (July 2008)
| Address: | VIA ROBERTO AGO 26 POSTAL CODE 00166 |
| Rome, ITALY | |
| Phone # for sales: | +393357540708 |
| E-mail address: | pezzutti.paolo@tiscali.it |
Click here for more information about our publications!
Comments
Date: 05/15/08Rank: Comment: dx,dkytcjtfvyukktv ,juthngretngrefgnhrf

Request Information From Our Sponsors
- StockCharts.com, Inc.
- Candle Patterns
- Candlestick Charting Explained
- Intermarket Technical Analysis
- John Murphy on Chart Analysis
- John Murphy's Chart Pattern Recognition
- John Murphy's Market Message
- MurphyExplainsMarketAnalysis-Intermarket Analysis
- MurphyExplainsMarketAnalysis-Visual Analysis
- StockCharts.com
- Technical Analysis of the Financial Markets
- The Visual Investor
- VectorVest, Inc.
- Executive Premier Workshop
- One-Day Options Course
- OptionsPro
- Retirement Income Workshop
- Sure-Fire Trading Systems (VectorVest, Inc.)
- Trading as a Business Workshop
- VectorVest 7 EOD
- VectorVest 7 RealTime/IntraDay
- VectorVest AutoTester
- VectorVest Educational Services
- VectorVest OnLine
- VectorVest Options Analyzer
- VectorVest ProGraphics v6.0
- VectorVest ProTrader 7
- VectorVest RealTime Derby Tool
- VectorVest Simulator
- VectorVest Variator
- VectorVest Watchdog
