HOT TOPICS LIST
- MACD
- Fibonacci
- RSI
- Gann
- ADXR
- Stochastics
- Volume
- Triangles
- Futures
- Cycles
- Volatility
- ZIGZAG
- MESA
- Retracement
- Aroon
INDICATORS LIST
LIST OF TOPICS
PRINT THIS ARTICLE
by Chaitali Mohile
The Russell Mid-Cap iShares has weak indicators and slowly developing uptrend to pull bullish rally higher.
Position: N/A
Chaitali Mohile
Active trader in the Indian stock markets since 2003 and a full-time writer. Trading is largely based upon technical analysis.
PRINT THIS ARTICLE
CHART ANALYSIS
The Developing Uptrend In IWR Seems Weak
06/03/08 01:38:18 PMby Chaitali Mohile
The Russell Mid-Cap iShares has weak indicators and slowly developing uptrend to pull bullish rally higher.
Position: N/A
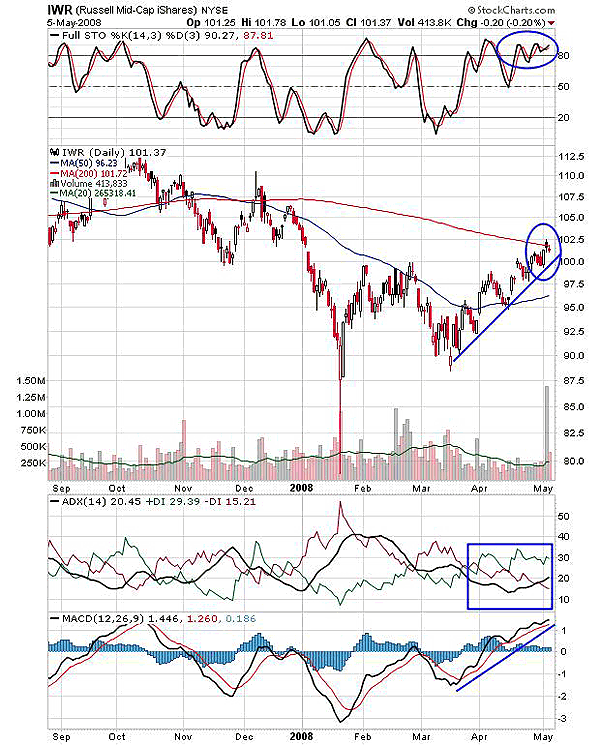
| The Russell Mid-Cap iShares (IWR) was forming lower highs and lower lows since October 2007, violating all the supports, and a strong downtrend developed thereafter. At 87.5, the stochastic (14,3,3) was oversold and the moving average convergence/divergence (MACD) (12,26,9) also tried to turn bullish by moving above the zero line with a bullish crossover. But the rally turned volatile under the pressure of a 50-day moving average and plunged closer to the previous support of 87.5. By now, the selling pressure indicated by the negative directional index (-DI) was lower than the previous and the downtrend weakened too. This was the perfect situation for a new bullish rally. See Figure 1. |

|
| FIGURE 1: IWR, DAILY. The ADX (14) suggests a weakly developing uptrend. The bullish rally may therefore consolidate at the resistance before moving ahead. |
| Graphic provided by: StockCharts.com. |
| |
| Thus, the rally that started from 90 extended to 102.5 and the average directional movement index (ADX) (14) moved above 20 with a marginal increase in buying pressure throughout the rally. The rally seems to be moving along the 200-day moving average resistance. The stochastic (14,3,3) is highly overbought and may slip below the bullish levels. Though the ADX (14) suggests a developing uptrend, the buying pressure and the volume are not responding enthusiastically, which may result in a weak uptrend. So the security is likely to witness volatile consolidation before it can surge to the resistance level. |

|
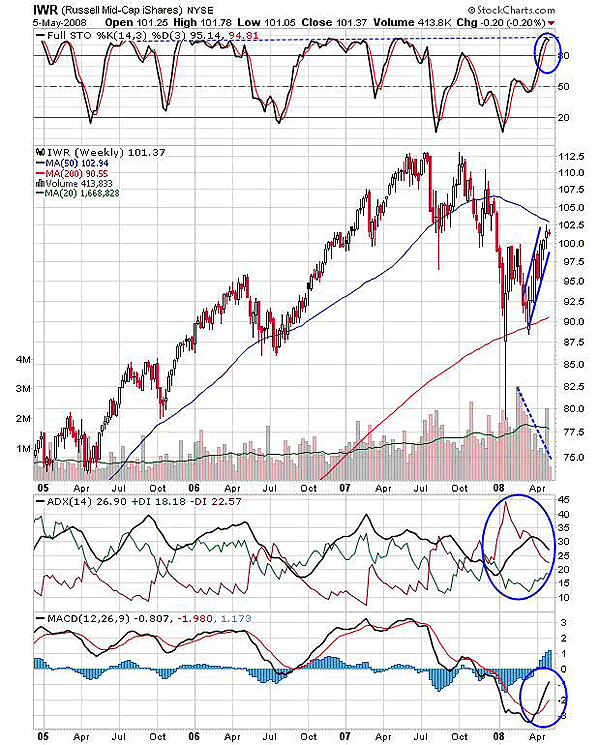
| FIGURE 2: IWR, WEEKLY. The rising wedge formed suggests an end to the upside rally. The ADX (14) shows a declining downtrend while the stochastic is highly overbought, so the bullish rally would stop heading up. |
| Graphic provided by: StockCharts.com. |
| |
| The vertical move with the support of 200-day MA in Figure 2 ultimately formed a rising wedge. The rising wedge is a reversal formation that ends the upward rally by breaking in a downward direction. The volume was going down while a wedge was being formed, confirming the pattern. Again, the 50-day moving average resistance is another reason that restricts the present bullish rally. The ADX (14) shows a declining downtrend and the buying pressure (+DI) is increasing, so it could be that in the coming session, bulls get on a ride. But currently, we could only see a reducing bearish trend so the developing uptrend on intraday basis may get affected. In addition, the stochastic (14,3,3) is highly overbought and this particular oscillator has never sustained above these levels. |
| Thus, the upward rally may consolidate due to a weak uptrend and an overbought stochastic. Though there is hardly any fear of downfall, the upside rally would also take time to gather the required strength. |
Active trader in the Indian stock markets since 2003 and a full-time writer. Trading is largely based upon technical analysis.
| Company: | Independent |
| Address: | C1/3 Parth Indraprasth Towers. Vastrapur |
| Ahmedabad, Guj 380015 | |
| E-mail address: | chaitalimohile@yahoo.co.in |
Traders' Resource Links | |
| Independent has not added any product or service information to TRADERS' RESOURCE. | |
Click here for more information about our publications!
PRINT THIS ARTICLE

Request Information From Our Sponsors
- StockCharts.com, Inc.
- Candle Patterns
- Candlestick Charting Explained
- Intermarket Technical Analysis
- John Murphy on Chart Analysis
- John Murphy's Chart Pattern Recognition
- John Murphy's Market Message
- MurphyExplainsMarketAnalysis-Intermarket Analysis
- MurphyExplainsMarketAnalysis-Visual Analysis
- StockCharts.com
- Technical Analysis of the Financial Markets
- The Visual Investor
- VectorVest, Inc.
- Executive Premier Workshop
- One-Day Options Course
- OptionsPro
- Retirement Income Workshop
- Sure-Fire Trading Systems (VectorVest, Inc.)
- Trading as a Business Workshop
- VectorVest 7 EOD
- VectorVest 7 RealTime/IntraDay
- VectorVest AutoTester
- VectorVest Educational Services
- VectorVest OnLine
- VectorVest Options Analyzer
- VectorVest ProGraphics v6.0
- VectorVest ProTrader 7
- VectorVest RealTime Derby Tool
- VectorVest Simulator
- VectorVest Variator
- VectorVest Watchdog
