HOT TOPICS LIST
- MACD
- Fibonacci
- RSI
- Gann
- ADXR
- Stochastics
- Volume
- Triangles
- Futures
- Cycles
- Volatility
- ZIGZAG
- MESA
- Retracement
- Aroon
INDICATORS LIST
LIST OF TOPICS
PRINT THIS ARTICLE
by Mike Carr, CMT
Small-cap growth stocks often lead the way higher after bear market declines.
Position: Buy
Mike Carr, CMT
Mike Carr, CMT, is a member of the Market Technicians Association, and editor of the MTA's newsletter, Technically Speaking. He is also the author of "Smarter Investing in Any Economy: The Definitive Guide to Relative Strength Investing," and "Conquering the Divide: How to Use Economic Indicators to Catch Stock Market Trends."
PRINT THIS ARTICLE
STRATEGIES
Small-Cap Growth Setting Up A Long Trade
05/09/08 08:40:40 AMby Mike Carr, CMT
Small-cap growth stocks often lead the way higher after bear market declines.
Position: Buy
| Over the very long term, academic studies show that value stocks outperform growth stocks. But growth and value stocks lead the market during different phases, and as a bear market ends, growth stocks usually outperform value stocks. After the devastating first quarter, the market has shown signs of strength and if it moves higher, growth stocks, in particular small-cap growth, are likely to be among the biggest gainers. |
| Exchange traded funds (ETFs) allow traders to easily make macro bets alongside hedge funds that employ the doctoral candidates-turned-traders who authored those academic studies. iShares Russell 2000 Growth Index (IWO) is a pure bet on that segment of the market. For more aggressive traders, Rydex 2x Russell 2000 (RRY) offers the potential to achieve twice the returns of the index if they are willing to accept twice the risk. |

|
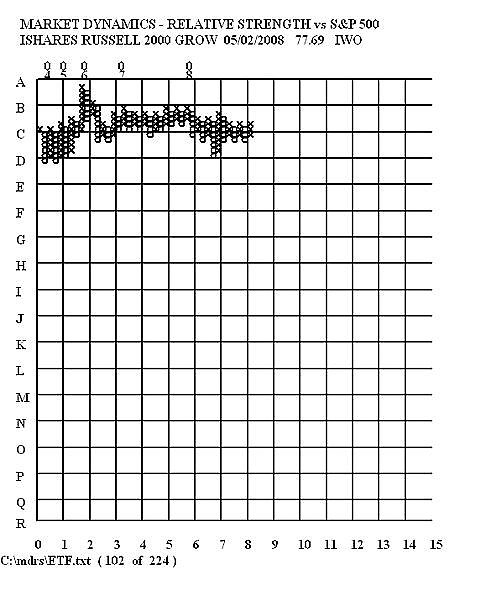
| FIGURE 1: IWO. The relative strength of IWO, shown here in a point & figure format, is range-bound. |
| Graphic provided by: Market Dynamics. |
| |
| A point & figure chart of the relative strength of IWO (Figure 1) shows that the ETF has been in an extended trading range since 2006. This means RS should be ready for an extended period of trending after breaking out of the range. It is currently near the top of that range. |

|
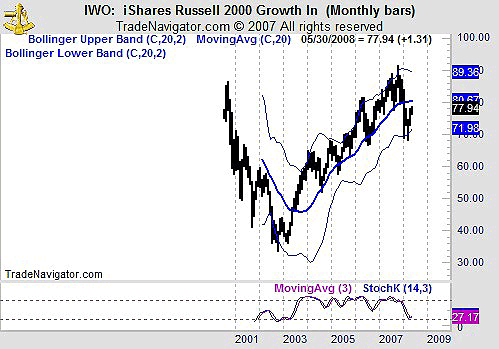
| FIGURE 2: IWO, MONTHLY. This chart of IWO shows prices supported by the lower Bollinger band and a stochastic buy signal. |
| Graphic provided by: Trade Navigator. |
| |
| Since point & figure charts eliminate the day-to-day noise of the market, we will use a monthly chart to assess the probable direction of the breakout in IWO (Figure 2). This chart is bullish with price at a support level and momentum oversold but turning higher. |

|
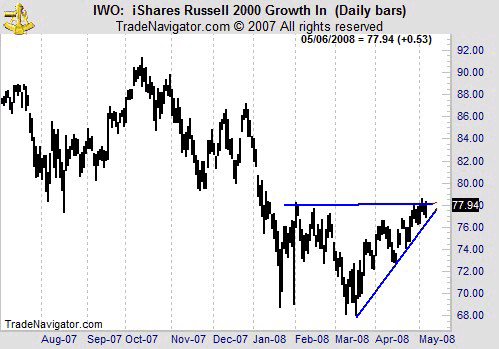
| FIGURE 3: IWO, DAILY. This chart of IWO is used to determine the location of the buy and stop orders. |
| Graphic provided by: Trade Navigator. |
| |
| Using a daily chart (Figure 3) to determine an entry point, we see that IWO is very close to the buy point. With a close above 78.25, IWO is through resistance and likely to move higher. The lower trendline offers a stop location, currently near 76. This is a trade worth watching given that the buy and stop prices are very close to current market action. |
Mike Carr, CMT, is a member of the Market Technicians Association, and editor of the MTA's newsletter, Technically Speaking. He is also the author of "Smarter Investing in Any Economy: The Definitive Guide to Relative Strength Investing," and "Conquering the Divide: How to Use Economic Indicators to Catch Stock Market Trends."
| Website: | www.moneynews.com/blogs/MichaelCarr/id-73 |
| E-mail address: | marketstrategist@gmail.com |
Click here for more information about our publications!
Comments
Date: 05/10/08Rank: 5Comment:
Date: 05/11/08Rank: 5Comment:
Date: 05/13/08Rank: 1Comment:

Request Information From Our Sponsors
- VectorVest, Inc.
- Executive Premier Workshop
- One-Day Options Course
- OptionsPro
- Retirement Income Workshop
- Sure-Fire Trading Systems (VectorVest, Inc.)
- Trading as a Business Workshop
- VectorVest 7 EOD
- VectorVest 7 RealTime/IntraDay
- VectorVest AutoTester
- VectorVest Educational Services
- VectorVest OnLine
- VectorVest Options Analyzer
- VectorVest ProGraphics v6.0
- VectorVest ProTrader 7
- VectorVest RealTime Derby Tool
- VectorVest Simulator
- VectorVest Variator
- VectorVest Watchdog
- StockCharts.com, Inc.
- Candle Patterns
- Candlestick Charting Explained
- Intermarket Technical Analysis
- John Murphy on Chart Analysis
- John Murphy's Chart Pattern Recognition
- John Murphy's Market Message
- MurphyExplainsMarketAnalysis-Intermarket Analysis
- MurphyExplainsMarketAnalysis-Visual Analysis
- StockCharts.com
- Technical Analysis of the Financial Markets
- The Visual Investor
