HOT TOPICS LIST
- MACD
- Fibonacci
- RSI
- Gann
- ADXR
- Stochastics
- Volume
- Triangles
- Futures
- Cycles
- Volatility
- ZIGZAG
- MESA
- Retracement
- Aroon
INDICATORS LIST
LIST OF TOPICS
PRINT THIS ARTICLE
by Mike Carr, CMT
Calling a bottom is always a risky bet. But a lot of technical indicators point to higher prices ahead for Steelcase.
Position: Buy
Mike Carr, CMT
Mike Carr, CMT, is a member of the Market Technicians Association, and editor of the MTA's newsletter, Technically Speaking. He is also the author of "Smarter Investing in Any Economy: The Definitive Guide to Relative Strength Investing," and "Conquering the Divide: How to Use Economic Indicators to Catch Stock Market Trends."
PRINT THIS ARTICLE
STRATEGIES
Bottom Fishing With Technical Indicators
05/07/08 09:01:58 AMby Mike Carr, CMT
Calling a bottom is always a risky bet. But a lot of technical indicators point to higher prices ahead for Steelcase.
Position: Buy
| Steelcase Inc. (SCS) makes office furniture, a profitable but unglamorous business. SCS has solid fundamentals with a P/E ratio of 13 and a dividend yield of 5.1%. The stock also has solid technicals. It should be considered a strong buy for traders and investors. |

|
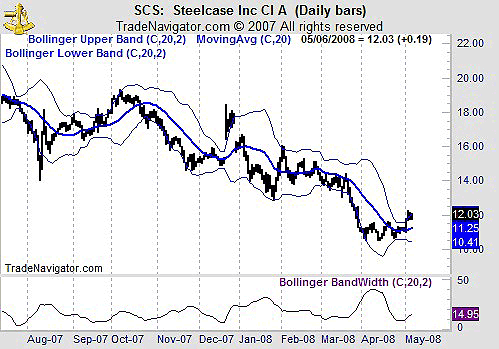
| FIGURE 1: BOLLINGER BANDWIDTH, DAILY. Bollinger BandWidth indicates that volatility is due to increase in SCS. |
| Graphic provided by: Trade Navigator. |
| |
| Figure 1, the daily chart, shows that volatility in SCS has recently decreased. On previous occasions when the Bollinger BandWidth reached this low level, rapid price moves in the stock followed. The fact that volatility is cyclical is well documented. This means that high volatility is followed by low volatility and vice versa. Bollinger BandWidth is useful for analyzing volatility but doesn't help traders understand which direction prices are likely to move. |

|
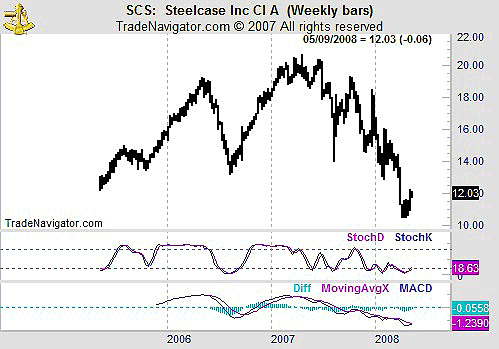
| FIGURE 2: STOCHASTICS AND MACD, WEEKLY. This chart of SCS shows oversold stochastics and MACD about to offer buy signals. |
| Graphic provided by: Trade Navigator. |
| |
| In Figure 2, we look at momentum indicators to see which way the stock is likely to move. SCS is extremely oversold and the moving average convergence/divergence (MACD) is on the verge of a buy signal for the first time in months. Stochastics offered a small bullish divergence at the recent low. The preponderance of evidence in SCS indicates the next move is likely to be higher. |
| Additional bullish support is found in the large short interest in SCS. Buyins.net reports that shorts will need more than eight days of normal trading volume to cover their positions in this stock. With almost 10% of the float shorted, there is a lot of potential demand. The squeeze trigger represents the average price level where short positions were initiated. At this level, many shorts are likely to cover their trade and find a more profitable opportunity in the market. Buyins.net calculates that the average short is nearly at a loss, since the squeeze trigger is 12.40. |
| SCS represents a strong buy with a stop at 11, the low of the breakout bar that should have marked a bottom in this downtrend. |
Mike Carr, CMT, is a member of the Market Technicians Association, and editor of the MTA's newsletter, Technically Speaking. He is also the author of "Smarter Investing in Any Economy: The Definitive Guide to Relative Strength Investing," and "Conquering the Divide: How to Use Economic Indicators to Catch Stock Market Trends."
| Website: | www.moneynews.com/blogs/MichaelCarr/id-73 |
| E-mail address: | marketstrategist@gmail.com |
Click here for more information about our publications!
Comments
Date: 05/07/08Rank: 4Comment:
Date: 05/07/08Rank: 5Comment:
Date: 05/08/08Rank: 3Comment:
Date: 05/20/08Rank: 4Comment:

Request Information From Our Sponsors
- StockCharts.com, Inc.
- Candle Patterns
- Candlestick Charting Explained
- Intermarket Technical Analysis
- John Murphy on Chart Analysis
- John Murphy's Chart Pattern Recognition
- John Murphy's Market Message
- MurphyExplainsMarketAnalysis-Intermarket Analysis
- MurphyExplainsMarketAnalysis-Visual Analysis
- StockCharts.com
- Technical Analysis of the Financial Markets
- The Visual Investor
- VectorVest, Inc.
- Executive Premier Workshop
- One-Day Options Course
- OptionsPro
- Retirement Income Workshop
- Sure-Fire Trading Systems (VectorVest, Inc.)
- Trading as a Business Workshop
- VectorVest 7 EOD
- VectorVest 7 RealTime/IntraDay
- VectorVest AutoTester
- VectorVest Educational Services
- VectorVest OnLine
- VectorVest Options Analyzer
- VectorVest ProGraphics v6.0
- VectorVest ProTrader 7
- VectorVest RealTime Derby Tool
- VectorVest Simulator
- VectorVest Variator
- VectorVest Watchdog
