

HOT TOPICS LIST
- MACD
- Fibonacci
- RSI
- Gann
- ADXR
- Stochastics
- Volume
- Triangles
- Futures
- Cycles
- Volatility
- ZIGZAG
- MESA
- Retracement
- Aroon
INDICATORS LIST
LIST OF TOPICS
PRINT THIS ARTICLE
by Ron Walker
The DJIA has had a nice run from its March low, but does the move have longevity? The DJIA chart indicates there should be plenty more upside.
Position: N/A
Ron Walker
Ron Walker is an active trader and technical analyst. He operates an educational website dedicated to the study of Technical Analysis. The website offers free market analysis with daily video presentations and written commentaries. Ron is a video pioneer, being one of the first to utilize the internet producing Technical Analysis videos. His website is thechartpatterntrader.com
PRINT THIS ARTICLE
CHART ANALYSIS
The DJIA Signals Better Days Ahead
05/16/08 12:55:29 PMby Ron Walker
The DJIA has had a nice run from its March low, but does the move have longevity? The DJIA chart indicates there should be plenty more upside.
Position: N/A
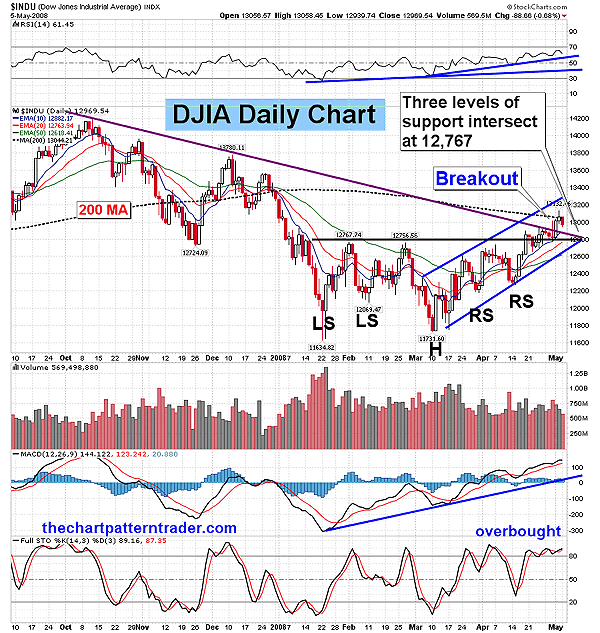
| In Figure 1, the Dow Jones Industrial Average (DJIA) established a support level during its January and March 2008 lows. With the March lows, a floor was established on the DJIA that allowed for a relief rally to transpire. The bulls carried the advance all the way up to overhead resistance near 12,767, where ultimately a breakout occurred in mid-April. Prices then consolidated for a short time, forming a handle off of the huge complex inverse head & shoulders pattern that developed during the first part of 2008. The advance had been strong up to this point, with a rising 10-, 20-, and 50-day exponential moving average (EMA). But prices needed the momentum to break the intermediate downward trend. |
|
| FIGURE 1: $INDU, DAILY. The DJIA is currently finding resistance at the 200-day SMA. But there are three areas of support that intersect near 12,767, the rising trendline horizontal support, and the recent broken trendline. This area might contain the next reaction. Watch the RSI's original trendline for long-term support levels. |
| Graphic provided by: StockCharts.com. |
| |
| Finally, on Thursday, May 1, 2008, the DJIA closed above the downtrend, surging above the peak of the handle that had formed. The DJIA then got a follow-through the next day, closing yet again higher on acceptable volume, but then found resistance at the 200-day simple moving average (SMA). Even with the 200-day SMA acting as resistance, the DJIA had a lot of support here. There are three places of key support intersections near 12,767, including the rising trendline, horizontal support, and the recent broken downward trendline. This seems to be a likely place for a backtest if a reaction occurs at these levels. Prices could even consolidate sideways, above 12,767 in a narrow trading range to build momentum, before going forward to tackle the 200-day SMA. |
| When prices breakout of intermediate trendline they either get a full intermediate retracement of price, or a period of consolidation. If consolidation occurs, a recognizable chart pattern will form. When trendline penetration occurs, it more often than not results in a backtest, as prices thrust back down to test the broken trendline. It is at this point where demand usually comes into play, allowing the broken trendline to maintain its authority, going unviolated. Sometimes, a backtest occcurs twice after a breakout. The first time occurs shortly after the intial breakout, while periodically a second touch occurs weeks later. If a successful backtest were to occur at the 12,767 level, it would allow a third touch to the rising trendline. That would change the trend from minor to intermediate, giving it more authority and making it less vulnerable. It also might allow the MACD to test its rising trendline, establishing support near the zero line while the relative strength index (RSI) (14) moves back down to test the original RSI trendline off the January trough low. |
|
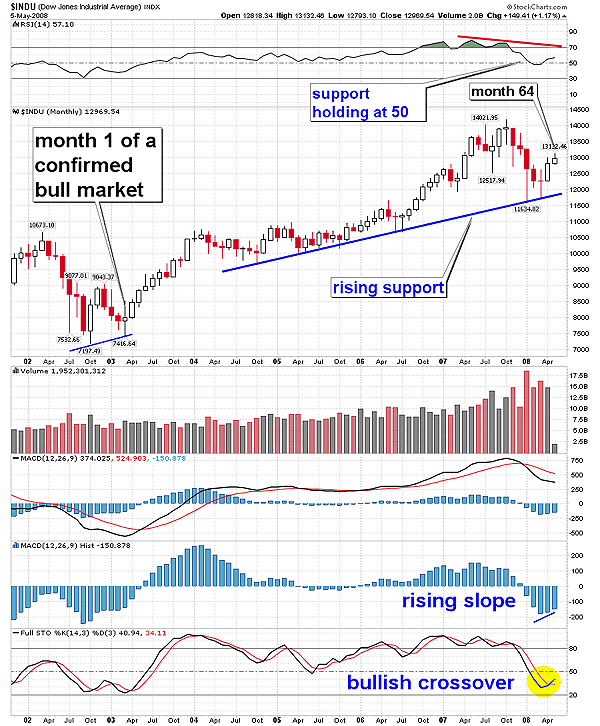
| FIGURE 1: $INDU, MONTHLY. The DJIA is in the 64th month of the bull market. The recent rally on the DJIA daily chart has caused some bullish events to take place on its monthly chart. The DJIA monthly chart got a bullish cross on the stochastic and currently has a rising slope on the MACD histogram. The RSI bounced off the 50 level and is rising back toward its previous peaks. |
| Graphic provided by: StockCharts.com. |
| |
| The DJIA's monthly chart reveals that a bull market has been under way for 64 months, and this particular time frame makes a strong case that there is much more upside potential on the daily charts. The chart has long-term trend support near 12,000. Figure 2 reveals several bullish events have taken place during April that should allow the DJIA to at least rise back up to the December 2007 peak of 13,780. First, the stochastic (14,3,3) line crossed above its signal line and is on the rise. Then moving average convergence/divergence (MACD) histogram (12,26,9) followed, closing the month with a higher bar, and thus the indicator had a rising slope. Third, the RSI bounced off the value of 50 and is now on its way to previous highs. In addition, the MACD could eventually get a bullish cross, allowing the indicator to form a lower peak than the one made in October, producing negative divergence. That means prices have a good shot of exceeding the October highs, but if negative divergence sets up, it could end the bull market sometime next year. This bullish chart is one of the reasons why I believe the correction that began in October 2007 has ended. This strength on the monthly chart should allow the daily chart to continue its long-term advance. Based on the monthly chart, a trader might want to look for an entry point during the next reaction, near the three support areas. |
Ron Walker is an active trader and technical analyst. He operates an educational website dedicated to the study of Technical Analysis. The website offers free market analysis with daily video presentations and written commentaries. Ron is a video pioneer, being one of the first to utilize the internet producing Technical Analysis videos. His website is thechartpatterntrader.com
| Website: | thechartpatterntrader.com |
| E-mail address: | thechartpatterntrader@gmail.com |
Click here for more information about our publications!
Comments
Date:�05/21/08Rank:�4Comment:�

Request Information From Our Sponsors
- VectorVest, Inc.
- Executive Premier Workshop
- One-Day Options Course
- OptionsPro
- Retirement Income Workshop
- Sure-Fire Trading Systems (VectorVest, Inc.)
- Trading as a Business Workshop
- VectorVest 7 EOD
- VectorVest 7 RealTime/IntraDay
- VectorVest AutoTester
- VectorVest Educational Services
- VectorVest OnLine
- VectorVest Options Analyzer
- VectorVest ProGraphics v6.0
- VectorVest ProTrader 7
- VectorVest RealTime Derby Tool
- VectorVest Simulator
- VectorVest Variator
- VectorVest Watchdog
- StockCharts.com, Inc.
- Candle Patterns
- Candlestick Charting Explained
- Intermarket Technical Analysis
- John Murphy on Chart Analysis
- John Murphy's Chart Pattern Recognition
- John Murphy's Market Message
- MurphyExplainsMarketAnalysis-Intermarket Analysis
- MurphyExplainsMarketAnalysis-Visual Analysis
- StockCharts.com
- Technical Analysis of the Financial Markets
- The Visual Investor