HOT TOPICS LIST
- MACD
- Fibonacci
- RSI
- Gann
- ADXR
- Stochastics
- Volume
- Triangles
- Futures
- Cycles
- Volatility
- ZIGZAG
- MESA
- Retracement
- Aroon
INDICATORS LIST
LIST OF TOPICS
PRINT THIS ARTICLE
by David Penn
Remember the two-year diamond top hovering over the Dow Jones Industrial Average that peaked in November 1999? The bears do.
Position: N/A
David Penn
Technical Writer for Technical Analysis of STOCKS & COMMODITIES magazine, Working-Money.com, and Traders.com Advantage.
PRINT THIS ARTICLE
CHART ANALYSIS
Return of the Diamond
05/04/01 02:31:56 PMby David Penn
Remember the two-year diamond top hovering over the Dow Jones Industrial Average that peaked in November 1999? The bears do.
Position: N/A
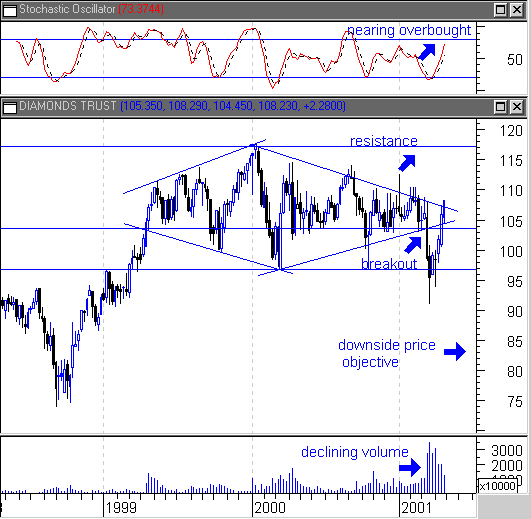
| Many of those who became interested in the diamond top pattern that developed over the span of about 22 months (roughly the spring of 1999 to date) may have become distracted by the Average's recent resilience. After what appeared to be a downside breakout in May, the DJIA--as represented by the Diamonds Unit Trust, or diamonds--retraced the down move and then some, rallying 18% from a low of 91 to 108, March through April. |
| This, however, doesn't mean that the diamond's down days are done. For starters, while the diamonds suggest that the Dow has not yet established a clear intermediate term trend, the March-April rally mentioned above came on a clearly declining volume trend (see chart). Price advances on retreating volume are almost always suspect and, in a market with a decidely negative bias, such an advance is best treated cautiously, if at all. |

|
| Declining volume on the rally, an overbought stochastic and a diamond top suggest lower prices for the DJIA. |
| Graphic provided by: MetaStock. |
| |
| Other reasons for bearishness arise from the characteristic behavior of diamond tops. Resistance with diamond tops, according to Bulkowski and others, is found at the top of the pattern (approximately 117 here). This provides for a sizeable pullback should one occur, and suggests that diamond tops may take some time to unwind and reach their downside price objective. |
| The measurement rule for diamond tops involves subtracting the difference between the highest high and the lowest low in the formation (essentially, the formation height) from the value at the point where prices breakout of the diamond pattern. In this case, a formation height of 20.385 (117.221 minus 96.836) is subtracted from the value at the breakout point in mid-March, or 103.583. Thus, the downside price objective for the diamond top is 83.198. |
| How reasonable is such a down move? The most recent low is 91, reached earlier this year. The price objective is only an 8% decline from that low. For lower lows, we need to look back to the spring and late fall of 1998, where a great deal of support exists in the form of two, half-year long consolidation zones. The lowest low in these zones is the low of 85 reached in June of 1998, although the zones are separated by a trough in the early fall of 1998 that saw prices as low as 73. Nevertheless, the support in the low 90s that existed in most of 1998 is formidable. While there may be plenty of downside to take advantage of from the Dow's diamond top, reaching the specific mathematical price objective suggested by the diamond top pattern may be more trouble than it's worth. |
Technical Writer for Technical Analysis of STOCKS & COMMODITIES magazine, Working-Money.com, and Traders.com Advantage.
| Title: | Technical Writer |
| Company: | Technical Analysis, Inc. |
| Address: | 4757 California Avenue SW |
| Seattle, WA 98116 | |
| Phone # for sales: | 206 938 0570 |
| Fax: | 206 938 1307 |
| Website: | www.Traders.com |
| E-mail address: | DPenn@traders.com |
Traders' Resource Links | |
| Charting the Stock Market: The Wyckoff Method -- Books | |
| Working-Money.com -- Online Trading Services | |
| Traders.com Advantage -- Online Trading Services | |
| Technical Analysis of Stocks & Commodities -- Publications and Newsletters | |
| Working Money, at Working-Money.com -- Publications and Newsletters | |
| Traders.com Advantage -- Publications and Newsletters | |
| Professional Traders Starter Kit -- Software | |
Click here for more information about our publications!
Comments
Date: 05/09/01Rank: 5Comment: xcllent article very knowledgeable
Date: 05/10/01Rank: 3Comment:

Request Information From Our Sponsors
- StockCharts.com, Inc.
- Candle Patterns
- Candlestick Charting Explained
- Intermarket Technical Analysis
- John Murphy on Chart Analysis
- John Murphy's Chart Pattern Recognition
- John Murphy's Market Message
- MurphyExplainsMarketAnalysis-Intermarket Analysis
- MurphyExplainsMarketAnalysis-Visual Analysis
- StockCharts.com
- Technical Analysis of the Financial Markets
- The Visual Investor
- VectorVest, Inc.
- Executive Premier Workshop
- One-Day Options Course
- OptionsPro
- Retirement Income Workshop
- Sure-Fire Trading Systems (VectorVest, Inc.)
- Trading as a Business Workshop
- VectorVest 7 EOD
- VectorVest 7 RealTime/IntraDay
- VectorVest AutoTester
- VectorVest Educational Services
- VectorVest OnLine
- VectorVest Options Analyzer
- VectorVest ProGraphics v6.0
- VectorVest ProTrader 7
- VectorVest RealTime Derby Tool
- VectorVest Simulator
- VectorVest Variator
- VectorVest Watchdog
