

HOT TOPICS LIST
- MACD
- Fibonacci
- RSI
- Gann
- ADXR
- Stochastics
- Volume
- Triangles
- Futures
- Cycles
- Volatility
- ZIGZAG
- MESA
- Retracement
- Aroon
INDICATORS LIST
LIST OF TOPICS
PRINT THIS ARTICLE
by Chaitali Mohile
The uptrend in Google is well developed and easily sustainable. Some minor twists suggest profit-booking for safe trade, as support can get retested.
Position: N/A
Chaitali Mohile
Active trader in the Indian stock markets since 2003 and a full-time writer. Trading is largely based upon technical analysis.
PRINT THIS ARTICLE
SUPPORT & RESISTANCE
Google May Retrace Back To Support Zone
06/02/08 01:31:12 PMby Chaitali Mohile
The uptrend in Google is well developed and easily sustainable. Some minor twists suggest profit-booking for safe trade, as support can get retested.
Position: N/A
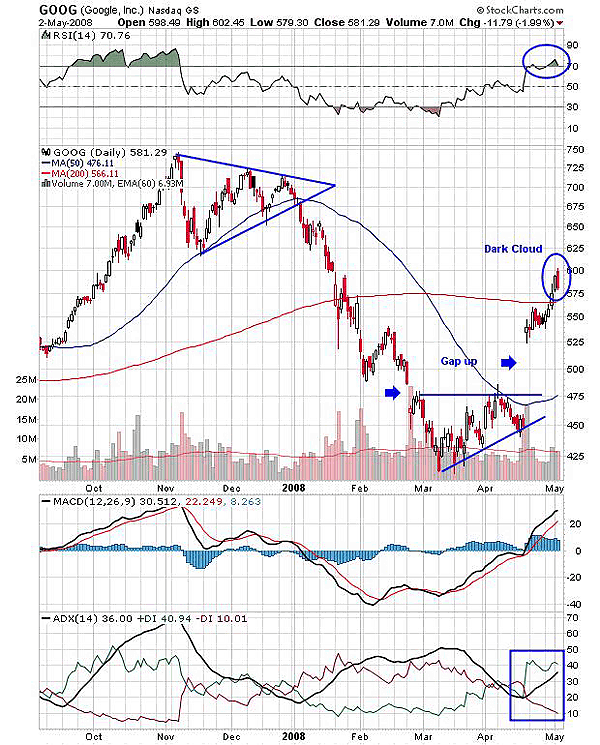
| Google (GOOG) entered the new uptrend with a huge gap up that violated the 200-day moving average resistance. The gap up breakout was highly bullish as an ascending triangle was formed. This triangle breakout was accompanied by encouraging volume that helped the rally sustain above the resistance converted to support. The relative strength index (RSI) also moved above 50, indicating a new beginning for bulls. The indicator also established support at overbought levels, another healthy sign for an ongoing upward rally. The moving average convergence/divergence (MACD) also surged in positive territory that supported the present move. Meanwhile, the buying pressure (+DI) crossed the negative directional index (-DI) from below, as a previous downtrend was turned down and bulls came in force. |
|
| FIGURE 1: GOOG, DAILY. After a symmetrical triangle breakout at the highest level of 700, GOOG tumbled 300 points approximately. While consolidating at the lower end, an ascending triangle was formed. As the stock broke off the pattern, the indicators have maintained their bullish pressure. The dark cloud cover could hardly damage the party. |
| Graphic provided by: StockCharts.com. |
| |
| Thus, the entire breakout rally was heavily loaded with a bullish force. A dark cloud cover, which suggests some bearish move in the next few sessions, was formed (Figure 1). The dark cloud cover is a bearish reversal pattern that occurs only in an uptrend. The pattern is strong by itself so it needs no confirmation. But here, I can see the retesting of a previous support line of a 200-day moving average. The uptrend is well developed and the other two indicators, MACD (12,26,9) and RSI (14), are bullish as well. In addition, there are various support levels below, that can prevent any damage if bears try to board the train. In such a situation, I would recommend profit-taking at current levels and entering new trades once the stock retraces from the support line. |
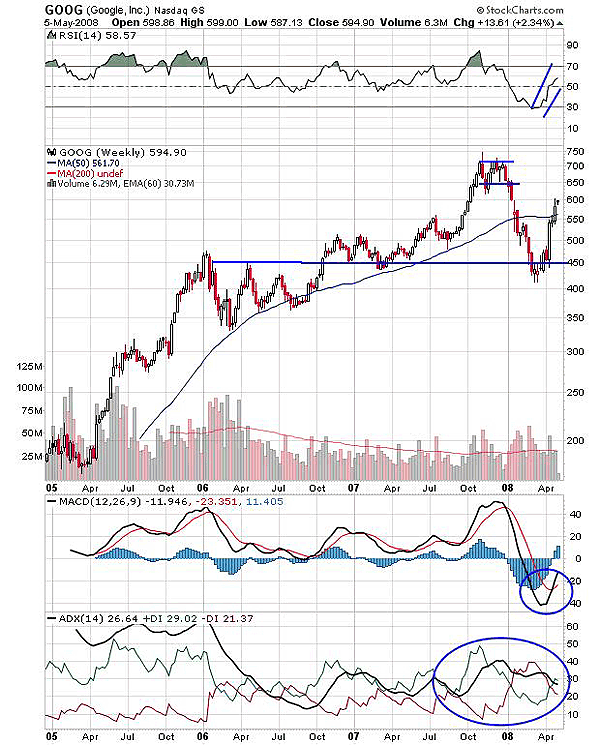
| On the weekly chart (Figure 2), the 450 level stands to be a strong support-resistance zone for rallies on both sides. GOOG consolidated at the top in a range of 700-650, forming a flag & pennant pattern. But the pattern failed to break upward and the stock went through a serious correction of about 350 points. During this downfall, the 50-day moving average support was also violated and prices moved further down toward the support level of 450. Meanwhile, the RSI (14) rested at a crucial level of 30 and the MACD (12,26,9) took a U-turn, suggesting that the likelihood of further downside was low. |
|
| FIGURE 2: GOOG, WEEKLY. The stock was trading above the strong support of a 50-day moving average. The indicators are favoring the bullish rally. |
| Graphic provided by: StockCharts.com. |
| |
| The fresh upside initiated was stronger than a previous bearish move. The 50-day MA resistance became support and the stock was comfortably trading in this support zone. The RSI (14) is above 50, indicating bullish strength in the rally, and the MACD (12,26,9) had a bullish crossover in negative territory. In addition, the histogram has pulled above the zero line. The ADX (14) shows a developing uptrend. |
| The bullish force is likely to continue, according to both charts. On the same notes, I would ask to take some profits and wait for the stock to come back to the support line. This support area would be the best buying level for traders and investors. |
Active trader in the Indian stock markets since 2003 and a full-time writer. Trading is largely based upon technical analysis.
| Company: | Independent |
| Address: | C1/3 Parth Indraprasth Towers. Vastrapur |
| Ahmedabad, Guj 380015 | |
| E-mail address: | chaitalimohile@yahoo.co.in |
Traders' Resource Links | |
| Independent has not added any product or service information to TRADERS' RESOURCE. | |
Click here for more information about our publications!
Comments
Date:�06/02/08Rank:�3Comment:�
Date:�06/08/08Rank:�5Comment:�I am also a technician but not certified but under the process...your goog thoughts are beyond my imagination and I totally agree with you about goog s pullback. I would wait the support line and be part of the short term downside..I shorted goog May 19...and felt the overall down fall of the market in that day and went several stocks short side and enjoyed the profit so far. Thanks

Request Information From Our Sponsors
- StockCharts.com, Inc.
- Candle Patterns
- Candlestick Charting Explained
- Intermarket Technical Analysis
- John Murphy on Chart Analysis
- John Murphy's Chart Pattern Recognition
- John Murphy's Market Message
- MurphyExplainsMarketAnalysis-Intermarket Analysis
- MurphyExplainsMarketAnalysis-Visual Analysis
- StockCharts.com
- Technical Analysis of the Financial Markets
- The Visual Investor
- VectorVest, Inc.
- Executive Premier Workshop
- One-Day Options Course
- OptionsPro
- Retirement Income Workshop
- Sure-Fire Trading Systems (VectorVest, Inc.)
- Trading as a Business Workshop
- VectorVest 7 EOD
- VectorVest 7 RealTime/IntraDay
- VectorVest AutoTester
- VectorVest Educational Services
- VectorVest OnLine
- VectorVest Options Analyzer
- VectorVest ProGraphics v6.0
- VectorVest ProTrader 7
- VectorVest RealTime Derby Tool
- VectorVest Simulator
- VectorVest Variator
- VectorVest Watchdog