HOT TOPICS LIST
- MACD
- Fibonacci
- RSI
- Gann
- ADXR
- Stochastics
- Volume
- Triangles
- Futures
- Cycles
- Volatility
- ZIGZAG
- MESA
- Retracement
- Aroon
INDICATORS LIST
LIST OF TOPICS
PRINT THIS ARTICLE
by Mike Carr, CMT
This stock shows signs of topping and presents a short opportunity to hedge long exposure in today's volatile markets.
Position: Sell
Mike Carr, CMT
Mike Carr, CMT, is a member of the Market Technicians Association, and editor of the MTA's newsletter, Technically Speaking. He is also the author of "Smarter Investing in Any Economy: The Definitive Guide to Relative Strength Investing," and "Conquering the Divide: How to Use Economic Indicators to Catch Stock Market Trends."
PRINT THIS ARTICLE
STRATEGIES
Time To Short Avon
05/06/08 09:03:21 AMby Mike Carr, CMT
This stock shows signs of topping and presents a short opportunity to hedge long exposure in today's volatile markets.
Position: Sell
| Avon (AVP) is a well-known company with a long history. Its fundamentals lag sector averages and the stock has underperformed the market over the past year. In short, AVP is a lackluster stock rated a "buy" by most analysts who follow it, below the "strong buy" rating reserved for stocks that analysts really recommend for purchase. |
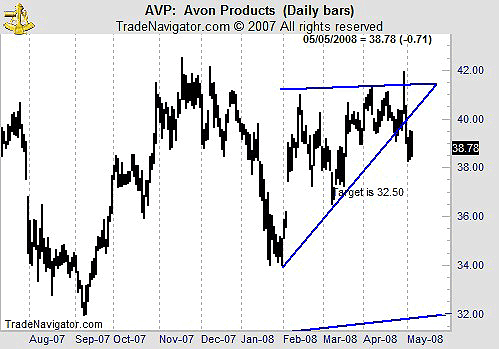
| Figure 1 shows that AVP has broken to the downside from a triangle formation. The target price from this pattern is near a long-term support level. While there may be some support for prices at the gap that occurred earlier this year, that level also offers an entry point for more conservative traders. They can enter the short at 37.75 as price begins to retrace that gap. |

|
| FIGURE 1: AVP, DAILY. Having broken a triangle formation and trendline, the next move in AVP is likely down. |
| Graphic provided by: Trade Navigator. |
| |
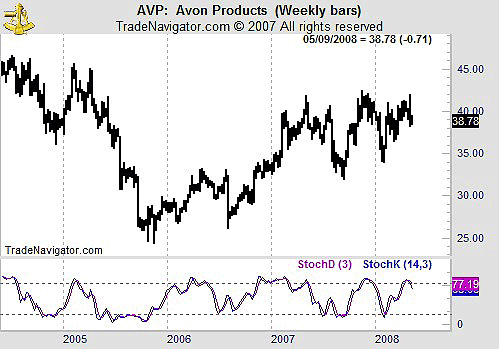
| Looking at Figure 2, we see that the stochastics indicator has just turned lower from an overbought condition. In the past, this indicator has reliably foretold price declines. |

|
| FIGURE 2: AVP, WEEKLY. The weekly chart of AVP confirms the bearishness evident in the daily chart. |
| Graphic provided by: Trade Navigator. |
| |
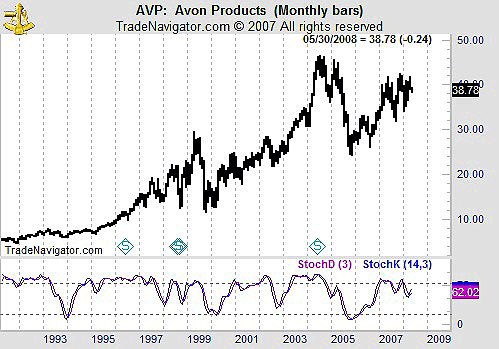
| Finally turning to Figure 3, a slight stochastic divergence is evident. While not as dramatic as the divergence seen in 2004–05, this one adds to the bearish evidence in AVP. The multiple-top pattern forming now also mirrors the pattern formed during that previous divergence. |

|
| FIGURE 3: AVP, MONTHLY. The monthly chart of AVP is also bearish. |
| Graphic provided by: Trade Navigator. |
| |
| AVP is worth considering as a short trade at current levels. A stop at 41, the highest weekly closing price reached this year, limits the risk to a manageable amount for even the most conservative traders. |
Mike Carr, CMT, is a member of the Market Technicians Association, and editor of the MTA's newsletter, Technically Speaking. He is also the author of "Smarter Investing in Any Economy: The Definitive Guide to Relative Strength Investing," and "Conquering the Divide: How to Use Economic Indicators to Catch Stock Market Trends."
| Website: | www.moneynews.com/blogs/MichaelCarr/id-73 |
| E-mail address: | marketstrategist@gmail.com |
Click here for more information about our publications!
Comments
Date: 05/06/08Rank: 5Comment:
Date: 05/08/08Rank: 3Comment:

Request Information From Our Sponsors
- VectorVest, Inc.
- Executive Premier Workshop
- One-Day Options Course
- OptionsPro
- Retirement Income Workshop
- Sure-Fire Trading Systems (VectorVest, Inc.)
- Trading as a Business Workshop
- VectorVest 7 EOD
- VectorVest 7 RealTime/IntraDay
- VectorVest AutoTester
- VectorVest Educational Services
- VectorVest OnLine
- VectorVest Options Analyzer
- VectorVest ProGraphics v6.0
- VectorVest ProTrader 7
- VectorVest RealTime Derby Tool
- VectorVest Simulator
- VectorVest Variator
- VectorVest Watchdog
- StockCharts.com, Inc.
- Candle Patterns
- Candlestick Charting Explained
- Intermarket Technical Analysis
- John Murphy on Chart Analysis
- John Murphy's Chart Pattern Recognition
- John Murphy's Market Message
- MurphyExplainsMarketAnalysis-Intermarket Analysis
- MurphyExplainsMarketAnalysis-Visual Analysis
- StockCharts.com
- Technical Analysis of the Financial Markets
- The Visual Investor
