

HOT TOPICS LIST
- MACD
- Fibonacci
- RSI
- Gann
- ADXR
- Stochastics
- Volume
- Triangles
- Futures
- Cycles
- Volatility
- ZIGZAG
- MESA
- Retracement
- Aroon
INDICATORS LIST
LIST OF TOPICS
PRINT THIS ARTICLE
by Arthur Hill
After basing for eight months, Labranche & Co. broke through resistance on big volume to signal the start of a big uptrend.
Position: Accumulate
Arthur Hill
Arthur Hill is currently editor of TDTrader.com, a website specializing in trading strategies, sector/industry specific breadth stats and overall technical analysis. He passed the Society of Technical Analysts (STA London) diploma exam with distinction is a Certified Financial Technician (CFTe). Prior to TD Trader, he was the Chief Technical Analyst for Stockcharts.com and the main contributor to the ChartSchool.
PRINT THIS ARTICLE
BREAKOUTS
A Big Breakout For Labranche
05/02/08 01:12:34 PMby Arthur Hill
After basing for eight months, Labranche & Co. broke through resistance on big volume to signal the start of a big uptrend.
Position: Accumulate
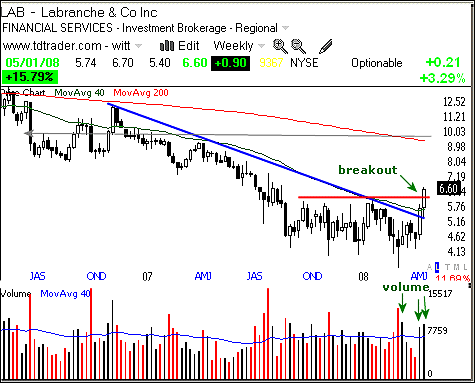
| In Figure 1, Labranche (LAB) declined below five in September 2007 and then traded flat until April 2008. The stock traded between 4 and 6.3 over this eight-month period and formed a big base. There were a few attempts to break below 4, but the stock recovered each time and held support. With a big surge over the last two weeks, the stock broke the trendline extending down from November 2006 and broke to an eight-month high. |
|
| FIGURE 1: LABRANCHE, WEEKLY. LAB declined before five in September 2007 and then traded flat until April 2008. |
| Graphic provided by: TeleChart2007. |
| |
| The eight-month consolidation could be considered a rectangle, and high volume validates the breakout. There was a high-volume advance five weeks ago and then a surge on high volume the last two weeks (green arrows). Volume is fuel and this breakout clearly has plenty of fuel. The upside target zone is around 9-10. This stems from the 200-week moving average and the 2006 consolidation (gray line). |
|
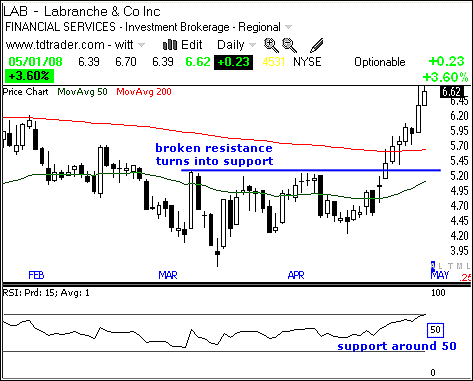
| FIGURE 2: LABRANCHE, DAILY. With a big move over the last two weeks, the stock has become a bit overbought. |
| Graphic provided by: TeleChart2007. |
| |
| With a big move over the last two weeks, the stock has become a bit overbought and ripe for a pullback. Broken resistance at 5.30 and the 200-day moving average (~5.6) now become support. These make for a support zone around 5.3–5.6. A pullback into this zone could offer a second chance to partake in the new uptrend. RSI recently moved to 70 and became overbought. 50 acts a support in an uptrend and a pullback to this area could also offer a second chance to partake in the uptrend. |
Arthur Hill is currently editor of TDTrader.com, a website specializing in trading strategies, sector/industry specific breadth stats and overall technical analysis. He passed the Society of Technical Analysts (STA London) diploma exam with distinction is a Certified Financial Technician (CFTe). Prior to TD Trader, he was the Chief Technical Analyst for Stockcharts.com and the main contributor to the ChartSchool.
| Title: | Editor |
| Company: | TDTrader.com |
| Address: | Willem Geetsstraat 17 |
| Mechelen, B2800 | |
| Phone # for sales: | 3215345465 |
| Website: | www.tdtrader.com |
| E-mail address: | arthurh@tdtrader.com |
Traders' Resource Links | |
| TDTrader.com has not added any product or service information to TRADERS' RESOURCE. | |
Click here for more information about our publications!
Comments
Date:�05/04/08Rank:�4Comment:�
Date:�05/07/08Rank:�4Comment:�

Request Information From Our Sponsors
- StockCharts.com, Inc.
- Candle Patterns
- Candlestick Charting Explained
- Intermarket Technical Analysis
- John Murphy on Chart Analysis
- John Murphy's Chart Pattern Recognition
- John Murphy's Market Message
- MurphyExplainsMarketAnalysis-Intermarket Analysis
- MurphyExplainsMarketAnalysis-Visual Analysis
- StockCharts.com
- Technical Analysis of the Financial Markets
- The Visual Investor
- VectorVest, Inc.
- Executive Premier Workshop
- One-Day Options Course
- OptionsPro
- Retirement Income Workshop
- Sure-Fire Trading Systems (VectorVest, Inc.)
- Trading as a Business Workshop
- VectorVest 7 EOD
- VectorVest 7 RealTime/IntraDay
- VectorVest AutoTester
- VectorVest Educational Services
- VectorVest OnLine
- VectorVest Options Analyzer
- VectorVest ProGraphics v6.0
- VectorVest ProTrader 7
- VectorVest RealTime Derby Tool
- VectorVest Simulator
- VectorVest Variator
- VectorVest Watchdog