HOT TOPICS LIST
- MACD
- Fibonacci
- RSI
- Gann
- ADXR
- Stochastics
- Volume
- Triangles
- Futures
- Cycles
- Volatility
- ZIGZAG
- MESA
- Retracement
- Aroon
INDICATORS LIST
LIST OF TOPICS
PRINT THIS ARTICLE
by Alan R. Northam
Moving averages are a simple way of defining the short-term, intermediate-term, and long-term market trends. The timing of these trends also help traders in determining how long these trends should last.
Position: N/A
Alan R. Northam
Alan Northam lives in the Dallas, Texas area and as an electronic engineer gave him an analytical mind from which he has developed a thorough knowledge of stock market technical analysis. His abilities to analyze the future direction of the stock market has allowed him to successfully trade of his own portfolio over the last 30 years. Mr. Northam is now retired and trading the stock market full time. You can reach him at inquiry@tradersclassroom.com or by visiting his website at http://www.tradersclassroom.com. You can also follow him on Twitter @TradersClassrm.
PRINT THIS ARTICLE
MOVING AVERAGES
Moving Averages Define Market Trends
05/02/08 02:09:26 PMby Alan R. Northam
Moving averages are a simple way of defining the short-term, intermediate-term, and long-term market trends. The timing of these trends also help traders in determining how long these trends should last.
Position: N/A
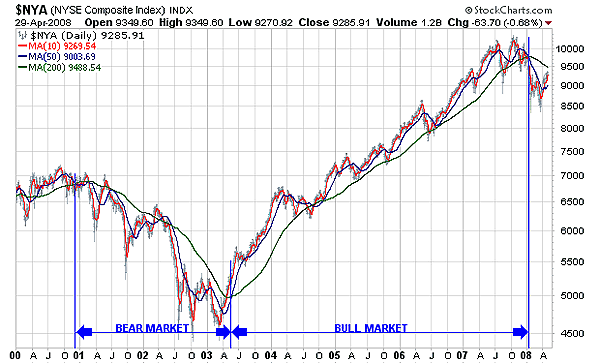
| Figure 1 shows the daily price bars of the Composite Index of the New York Stock Exchange from 2000 to 2008 to date along with three moving averages. I have shown the daily price bars in gray, the 10-day moving average in red, the 50-day moving average in blue, and the 200-day moving average in green. The 10-day moving average, shown in red, reflects the short-term trends of the market and lasts from a few days to approximately three weeks. The market is in a short-term uptrend when the 10-day moving average is pointing upward and is in a short-term downtrend when the 10-day moving average is pointing downward. The 50-day moving average, shown in blue, reflects the intermediate-term trends of the market lasting from three weeks to approximately three to six months. The market is in an intermediate-term uptrend when the 50-day moving average is pointing upward and is in an intermediate-term downtrend when the 50-day moving average is pointing downward. The 200-day moving average defines the long-term trend of the market that can last from approximately six months to several years. When the 200-day moving average and the moving average is pointing upward, the market is said to be in a long-term uptrend known as a bull market. And when the 200-day moving average and the moving average is pointing downward, the market is said to be in a long-term downtrend known as a bear market. Please note that these time frames for each of these moving averages are given for reference purposes only and can vary. |

|
| FIGURE 1: NYSE COMPOSITE INDEX, DAILY. Here's the daily price chart of the NYSE Composite Index showing 10-day, 50-day, and 200-day moving averages. |
| Graphic provided by: StockCharts.com. |
| |
| One way to mark the beginning and ending of a bull market and/or a bear market is to look for the crossover of the 50-day and 200-day moving averages. When the 50-day moving average crosses above the 200-day moving average, the market is defined as having entered into a bull market. This crossover is known as the "golden cross." The end of the bull market occurs when the 50-day moving average crosses under the 200-day moving average. This cross under is known as the "dead cross," signifying the death of the bull market and the beginning of a bear market. |
| In Figure 1, note that the 50-day moving average crossed above the 200-day moving average in 2003 and established the market in a long-term bull market that lasted for almost five years. Recall that bull markets last from six months to several years. In addition, note that the bear market that started in late 2000 lasted for about two and one half years. Bear markets last from approximately a third to as much as two-thirds the length of bull markets. Finally, note that the 50-day moving average crossed under the 200-day moving average in early January 2008 and the 200-day moving average is pointing downward. This marks the beginning of 2008 as the date when the New York Stock Exchange Composite Index entered into a long-term bear market. After all, the bull market of 2003 lasted for nearly five years and it is well past time for a bear market to emerge. |
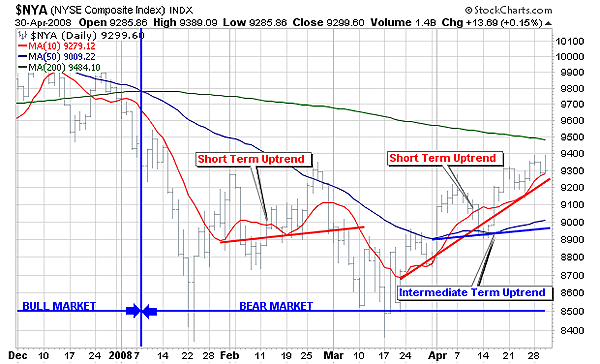
| In Figure 2, I have zoomed in on the daily price chart of Figure 1 to show more of the details of this market since the beginning of 2008. Note that the market entered into a short-term uptrend on two different occasions since the beginning of the bear market. The first occurrence was in late January to the end of February 2008, when the 10-day moving average pointed upward. The second occurrence occurred in late March 2008 and continues to this date. During the first occurrence, the short-term uptrend was confined below the 50-day moving average and is known as a short-term corrective rally within the confines of the intermediate-term downtrend. The second occurrence, however, is different, as the daily price bars not only started trading above the 10-day moving average but also traded above the 50-day moving average. In addition, the 10-day moving average crossed above the 50-day moving average. This short-term uptrend is known as a short-term market correction within the confines of a long-term bear market. |

|
| FIGURE 2: NYSE COMPOSITE INDEX, DAILY. Here's a closeup view of the daily price chart of the NYSE Composite Index showing short-term and intermediate-term corrective rallies. |
| Graphic provided by: StockCharts.com. |
| |
| Figure 2 also shows that the market entered into an intermediate-term uptrend in early April 2008 when the market started trading above the 50-day moving average and the moving average started pointing upward. This intermediate-term uptrend is known as an intermediate-term corrective rally within a long-term bear market. Corrective rallies occur after the market has made a significant move such as downward. The market has a way of getting ahead of itself by moving too fast in one direction. In the case of a bear market, traders will always become overzealous and sell the market below its perceived market value. Technicians say that the market is oversold. Corrective rallies are periods when traders correct for their overzealousness in selling off the market below its market value. One point that I want to emphasize is the timing of these various market trends. When a moving average, such as the 50-day moving average, turns upward, traders should be aware that this new intermediate-term uptrend will most likely last from approximately three weeks to as much as three to six months. Being aware of the typical time frames for the various market trends such as short term, intermediate term, and long term, will help to keep traders from entering into a market position too quickly. Waiting for these trends to run their course will allow traders to enter into the market at a much better price. Moving averages are a simple way of defining the market trend or trends. From Figures 1 and 2, we see that overall the New York Stock Exchange Composite Index is in a bear market trend, as noted by the 200-day moving average pointing downward that could last from six months to several years. We also note that within the confines of this bear market, the New York Stock Exchange Composite Index is currently experiencing short-term and intermediate-term corrective rallies that could last from three weeks to six months. Note that the short-term trend is already more than four weeks old and is due to end. Once these corrective rallies have worked off the market's short-term and intermediate-term oversold conditions, traders will resume their selling, driving the market downward once again. As a final note, the bear market is now only four months old and has not yet met the minimum time frame for bear markets. So traders should expect this market to continue selling off for several more months to come. |
Alan Northam lives in the Dallas, Texas area and as an electronic engineer gave him an analytical mind from which he has developed a thorough knowledge of stock market technical analysis. His abilities to analyze the future direction of the stock market has allowed him to successfully trade of his own portfolio over the last 30 years. Mr. Northam is now retired and trading the stock market full time. You can reach him at inquiry@tradersclassroom.com or by visiting his website at http://www.tradersclassroom.com. You can also follow him on Twitter @TradersClassrm.
| Garland, Tx | |
| Website: | www.tradersclassroom.com |
| E-mail address: | inquiry@tradersclassroom.com |
Click here for more information about our publications!
Comments
Date: 05/04/08Rank: 5Comment:
Date: 05/04/08Rank: 5Comment:

Request Information From Our Sponsors
- StockCharts.com, Inc.
- Candle Patterns
- Candlestick Charting Explained
- Intermarket Technical Analysis
- John Murphy on Chart Analysis
- John Murphy's Chart Pattern Recognition
- John Murphy's Market Message
- MurphyExplainsMarketAnalysis-Intermarket Analysis
- MurphyExplainsMarketAnalysis-Visual Analysis
- StockCharts.com
- Technical Analysis of the Financial Markets
- The Visual Investor
- VectorVest, Inc.
- Executive Premier Workshop
- One-Day Options Course
- OptionsPro
- Retirement Income Workshop
- Sure-Fire Trading Systems (VectorVest, Inc.)
- Trading as a Business Workshop
- VectorVest 7 EOD
- VectorVest 7 RealTime/IntraDay
- VectorVest AutoTester
- VectorVest Educational Services
- VectorVest OnLine
- VectorVest Options Analyzer
- VectorVest ProGraphics v6.0
- VectorVest ProTrader 7
- VectorVest RealTime Derby Tool
- VectorVest Simulator
- VectorVest Variator
- VectorVest Watchdog
