HOT TOPICS LIST
- MACD
- Fibonacci
- RSI
- Gann
- ADXR
- Stochastics
- Volume
- Triangles
- Futures
- Cycles
- Volatility
- ZIGZAG
- MESA
- Retracement
- Aroon
INDICATORS LIST
LIST OF TOPICS
PRINT THIS ARTICLE
by Mike Carr, CMT
With economists now predicting that the recession should be brief and shallow, traders may want to consider relative strength strategies to be ready to profit from the recovery.
Position: Buy
Mike Carr, CMT
Mike Carr, CMT, is a member of the Market Technicians Association, and editor of the MTA's newsletter, Technically Speaking. He is also the author of "Smarter Investing in Any Economy: The Definitive Guide to Relative Strength Investing," and "Conquering the Divide: How to Use Economic Indicators to Catch Stock Market Trends."
PRINT THIS ARTICLE
REL. STR COMPARATIVE
Be Ready For The End Of The Recession
05/01/08 12:09:28 PMby Mike Carr, CMT
With economists now predicting that the recession should be brief and shallow, traders may want to consider relative strength strategies to be ready to profit from the recovery.
Position: Buy
| The latest poll of 100 economists conducted by Reuters indicated that they believed the US economy nearly stalled in the first three months of the year and will shrink in the second quarter, but any recession should be less severe than the last major downturn in the early 1990s. The economy is expected to turn up in the second half of 2008, ending 2008 with 1% growth. The economists are also predicting a rebound to 2.1% growth in 2009. Looking at history, it might be time to buy regional bank stocks in anticipation of that recovery. |
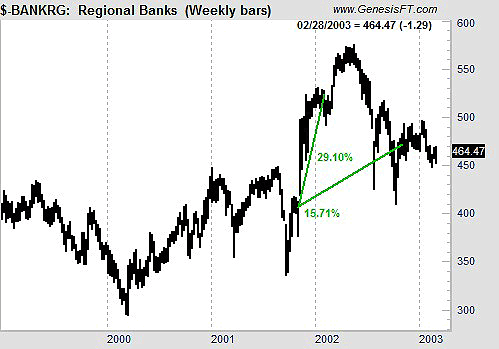
| Applying relative strength to the stock market as the last recession ended, we find that regional banks were the best-performing group over the next quarter and the next year. According to the National Bureau of Economic Research, the last recession lasted eight months and ended in November 2001. In Figure 1, we see that the regional bank group traded more than 29% higher in the three months immediately after the end of the recession and held half those gains over the next year. By comparison, the S&P gained 6% in the quarter after the bottom and was 17% lower a year later. |

|
| FIGURE 1: BANKRG, WEEKLY. Regional banks were the best-performing sector after the last recession ended. |
| Graphic provided by: Trade Navigator. |
| |
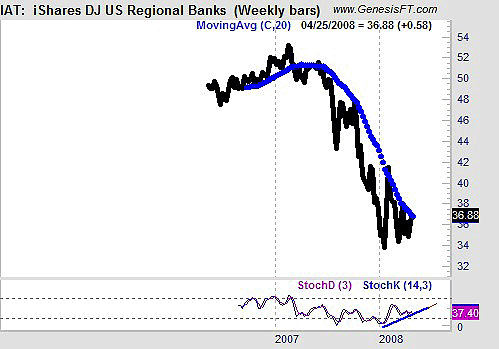
| If history repeats, now may be the time for traders to initiate positions in iShares Dow Jones US Regional Banks (IAT). The weekly chart (Figure 2) shows that the bottom may already be in. |

|
| FIGURE 2: IAT, WEEKLY. Here's a weekly chart of IAT with stochastics and 20-week moving average. |
| Graphic provided by: Trade Navigator. |
| |
| The stochastics has been indicating a bullish divergence since the beginning of the year. The 20-week moving average has proven to be formidable resistance for more than a year. A break of that average would represent a buy signal. A trading strategy would be to place 3% bands on the moving average and buy when the price closes more than 3% above the average. On the principle that resistance once broken becomes support, the 20-week moving average can then be used as a trailing stop. This offers a complete strategy with 6% risk and a clear exit plan. |
Mike Carr, CMT, is a member of the Market Technicians Association, and editor of the MTA's newsletter, Technically Speaking. He is also the author of "Smarter Investing in Any Economy: The Definitive Guide to Relative Strength Investing," and "Conquering the Divide: How to Use Economic Indicators to Catch Stock Market Trends."
| Website: | www.moneynews.com/blogs/MichaelCarr/id-73 |
| E-mail address: | marketstrategist@gmail.com |
Click here for more information about our publications!
PRINT THIS ARTICLE

Request Information From Our Sponsors
- VectorVest, Inc.
- Executive Premier Workshop
- One-Day Options Course
- OptionsPro
- Retirement Income Workshop
- Sure-Fire Trading Systems (VectorVest, Inc.)
- Trading as a Business Workshop
- VectorVest 7 EOD
- VectorVest 7 RealTime/IntraDay
- VectorVest AutoTester
- VectorVest Educational Services
- VectorVest OnLine
- VectorVest Options Analyzer
- VectorVest ProGraphics v6.0
- VectorVest ProTrader 7
- VectorVest RealTime Derby Tool
- VectorVest Simulator
- VectorVest Variator
- VectorVest Watchdog
- StockCharts.com, Inc.
- Candle Patterns
- Candlestick Charting Explained
- Intermarket Technical Analysis
- John Murphy on Chart Analysis
- John Murphy's Chart Pattern Recognition
- John Murphy's Market Message
- MurphyExplainsMarketAnalysis-Intermarket Analysis
- MurphyExplainsMarketAnalysis-Visual Analysis
- StockCharts.com
- Technical Analysis of the Financial Markets
- The Visual Investor
