HOT TOPICS LIST
- MACD
- Fibonacci
- RSI
- Gann
- ADXR
- Stochastics
- Volume
- Triangles
- Futures
- Cycles
- Volatility
- ZIGZAG
- MESA
- Retracement
- Aroon
INDICATORS LIST
LIST OF TOPICS
PRINT THIS ARTICLE
by James Kupfer
Recent price action in the Vanguard REIT ETF suggests a top of at least intermediate-term importance may be upon us.
Position: Sell
James Kupfer
Mr. Kupfer is a market professional and amateur stock market commentator. Disclosure: It is likely that Mr. Kupfer has or will enter a position in any security he writes about.
PRINT THIS ARTICLE
TECHNICAL ANALYSIS
REITs Turning Down?
05/01/08 10:43:26 AMby James Kupfer
Recent price action in the Vanguard REIT ETF suggests a top of at least intermediate-term importance may be upon us.
Position: Sell
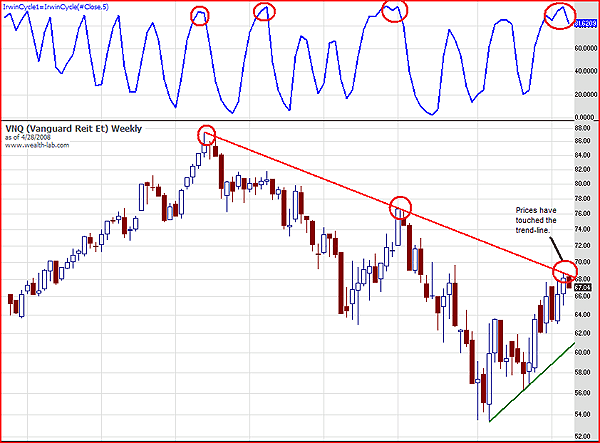
| Looking at the weekly chart of VNQ (Figure 1), you will note a few things. First, drawing a trendline starting at the exchange traded fund's (ETF) top in February 2007 and connecting it to the secondary top in October 2007 produces a downward-sloping trend (shown in red). Prices have moved from VNQ's January 2008 low back up to reach the trendline near the $68 level. Of course, that in no way means the stock is doomed just because it has reached its downward-sloping trendline. So let's look at what else is going on. |

|
| FIGURE 1: VNQ, WEEKLY. A downward-sloping trendline like the one seen here doesn't mean that the stock is doomed. |
| Graphic provided by: Wealth Lab. |
| |
| In addition to reaching the resistance level of the downward trendline, the Irwin cycle stochastic indicator has turned down from overbought levels (top pane). I have circled the previous times the indicator has penetrated the 80 level so you can see that they coincide with important price tops. So from a weekly perspective, we have an ETF that has so far turned down upon reaching long-term resistance along with being weak from being overbought. |
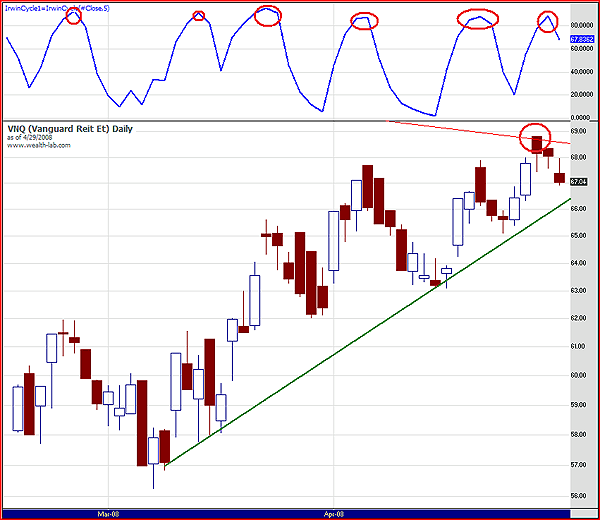
| How does the picture look from a daily perspective? Not much better, I'm afraid (Figure 2). You can see a better picture of VNQ touching and then retreating from the long-term trendline (circled). In addition, above the prices you can see that the Irwin cycle stochastic has turned down from overbought levels. As on the weekly chart, the times where the Irwin cycle reaches above 80 and then turns down prove to be at least short-term tops. On a positive note, the upward-sloping trendline shown in green suggests there is still upward price pressure on VNQ. However, given the current price picture, I do not think it will be sufficient to power VNQ through its long-term downward trend. |

|
| FIGURE 2: VNQ, DAILY. The perspective's not much better from a daily view. |
| Graphic provided by: Wealth-Lab. |
| |
| Aggressive traders may wish to take a position around current levels with a stop north of $69. If you want further confirmation that VNQ is likely to hold its long-term trend, wait until prices stay below $66 for at least a few days or there is a strong downward price movement. |
Mr. Kupfer is a market professional and amateur stock market commentator. Disclosure: It is likely that Mr. Kupfer has or will enter a position in any security he writes about.
Click here for more information about our publications!
Comments
Date: 05/05/08Rank: 5Comment:

|

Request Information From Our Sponsors
- StockCharts.com, Inc.
- Candle Patterns
- Candlestick Charting Explained
- Intermarket Technical Analysis
- John Murphy on Chart Analysis
- John Murphy's Chart Pattern Recognition
- John Murphy's Market Message
- MurphyExplainsMarketAnalysis-Intermarket Analysis
- MurphyExplainsMarketAnalysis-Visual Analysis
- StockCharts.com
- Technical Analysis of the Financial Markets
- The Visual Investor
- VectorVest, Inc.
- Executive Premier Workshop
- One-Day Options Course
- OptionsPro
- Retirement Income Workshop
- Sure-Fire Trading Systems (VectorVest, Inc.)
- Trading as a Business Workshop
- VectorVest 7 EOD
- VectorVest 7 RealTime/IntraDay
- VectorVest AutoTester
- VectorVest Educational Services
- VectorVest OnLine
- VectorVest Options Analyzer
- VectorVest ProGraphics v6.0
- VectorVest ProTrader 7
- VectorVest RealTime Derby Tool
- VectorVest Simulator
- VectorVest Variator
- VectorVest Watchdog
