HOT TOPICS LIST
- MACD
- Fibonacci
- RSI
- Gann
- ADXR
- Stochastics
- Volume
- Triangles
- Futures
- Cycles
- Volatility
- ZIGZAG
- MESA
- Retracement
- Aroon
INDICATORS LIST
LIST OF TOPICS
PRINT THIS ARTICLE
by Mike Carr, CMT
Using a nontraditional approach to relative strength, we find that QQQQ is a buy.
Position: Buy
Mike Carr, CMT
Mike Carr, CMT, is a member of the Market Technicians Association, and editor of the MTA's newsletter, Technically Speaking. He is also the author of "Smarter Investing in Any Economy: The Definitive Guide to Relative Strength Investing," and "Conquering the Divide: How to Use Economic Indicators to Catch Stock Market Trends."
PRINT THIS ARTICLE
REL. STR COMPARATIVE
Applying Relative Strength To ETFs
04/30/08 10:18:45 AMby Mike Carr, CMT
Using a nontraditional approach to relative strength, we find that QQQQ is a buy.
Position: Buy
| Traditional relative strength analysis consists of comparing a basket of stocks or the components of an index to the overall market and determining which ones are the strongest. The strongest are bought and the weakest are avoided. This approach works very well. However, many traders fail to consider that relative strength analysis can be completed for individual stocks, a fact that is especially useful for analyzing index-based exchange traded funds (ETFs) such as the PowerShares QQQ (QQQQ), which represents the NASDAQ 100. |
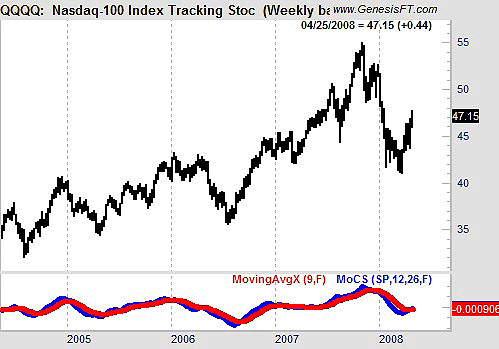
| In Figure 1, we show the QQQQ with an indicator known as the momentum of comparative strength (MoCS). This indicator applies the standard moving average convergence/divergence (MACD) calculation to graphically capture the relative strength of an individual stock. Rather than calculating the indicator using the price of the security, a ratio of the close to a market index such as the Standard & Poor's 500 is used. In this case, when the blue line crosses above the red line, the individual stock is outperforming the overall market. |

|
| FIGURE 1: QQQQ, WEEKLY. The weekly chart has just offered a buy signal based upon MoCS. |
| Graphic provided by: Trade Navigator. |
| |
| When analyzing index ETFs, an additional relative strength tool that can be used is the breadth of the index components. In this case, we look at the number of NASDAQ 100 stocks that are trading above their 10-week moving average. In a healthy market, the majority of stocks will be moving together. This view uses a point & figure chart to provide insight into the longer-term trend without being confused by the day-to-day price action. |

|
| FIGURE 2: QQQQ. Higher lows and higher highs indicate an uptrend in breadth is in place, a healthy condition for a long position. |
| Graphic provided by: Market Dynamics. |
| |
| Breadth confirms price in this case, with 68% of the stocks trading higher than their 10-week moving averages. Overall, the QQQQ presents a buying opportunity based upon relative strength analysis. The sell signal would come from MoCS in this analysis. |
Mike Carr, CMT, is a member of the Market Technicians Association, and editor of the MTA's newsletter, Technically Speaking. He is also the author of "Smarter Investing in Any Economy: The Definitive Guide to Relative Strength Investing," and "Conquering the Divide: How to Use Economic Indicators to Catch Stock Market Trends."
| Website: | www.moneynews.com/blogs/MichaelCarr/id-73 |
| E-mail address: | marketstrategist@gmail.com |
Click here for more information about our publications!
Comments
Date: 05/06/08Rank: 2Comment:

|

Request Information From Our Sponsors
- StockCharts.com, Inc.
- Candle Patterns
- Candlestick Charting Explained
- Intermarket Technical Analysis
- John Murphy on Chart Analysis
- John Murphy's Chart Pattern Recognition
- John Murphy's Market Message
- MurphyExplainsMarketAnalysis-Intermarket Analysis
- MurphyExplainsMarketAnalysis-Visual Analysis
- StockCharts.com
- Technical Analysis of the Financial Markets
- The Visual Investor
- VectorVest, Inc.
- Executive Premier Workshop
- One-Day Options Course
- OptionsPro
- Retirement Income Workshop
- Sure-Fire Trading Systems (VectorVest, Inc.)
- Trading as a Business Workshop
- VectorVest 7 EOD
- VectorVest 7 RealTime/IntraDay
- VectorVest AutoTester
- VectorVest Educational Services
- VectorVest OnLine
- VectorVest Options Analyzer
- VectorVest ProGraphics v6.0
- VectorVest ProTrader 7
- VectorVest RealTime Derby Tool
- VectorVest Simulator
- VectorVest Variator
- VectorVest Watchdog
