HOT TOPICS LIST
- MACD
- Fibonacci
- RSI
- Gann
- ADXR
- Stochastics
- Volume
- Triangles
- Futures
- Cycles
- Volatility
- ZIGZAG
- MESA
- Retracement
- Aroon
INDICATORS LIST
LIST OF TOPICS
PRINT THIS ARTICLE
by Ron Walker
All the major averages recently moved above overhead resistance, breaking out of inverse complex head & shoulders patterns. They are now resting right below their intermediate downward trendlines as handles are forming off the patterns. Do the indexes now have the momentum they need to break the declining trendlines? The trend-based indicators imply that they are poised for a breakout.
Position: N/A
Ron Walker
Ron Walker is an active trader and technical analyst. He operates an educational website dedicated to the study of Technical Analysis. The website offers free market analysis with daily video presentations and written commentaries. Ron is a video pioneer, being one of the first to utilize the internet producing Technical Analysis videos. His website is thechartpatterntrader.com
PRINT THIS ARTICLE
HEAD & SHOULDERS
Inverse Complex Head & Shoulders Patterns Form A Bottom
05/01/08 12:26:51 PMby Ron Walker
All the major averages recently moved above overhead resistance, breaking out of inverse complex head & shoulders patterns. They are now resting right below their intermediate downward trendlines as handles are forming off the patterns. Do the indexes now have the momentum they need to break the declining trendlines? The trend-based indicators imply that they are poised for a breakout.
Position: N/A
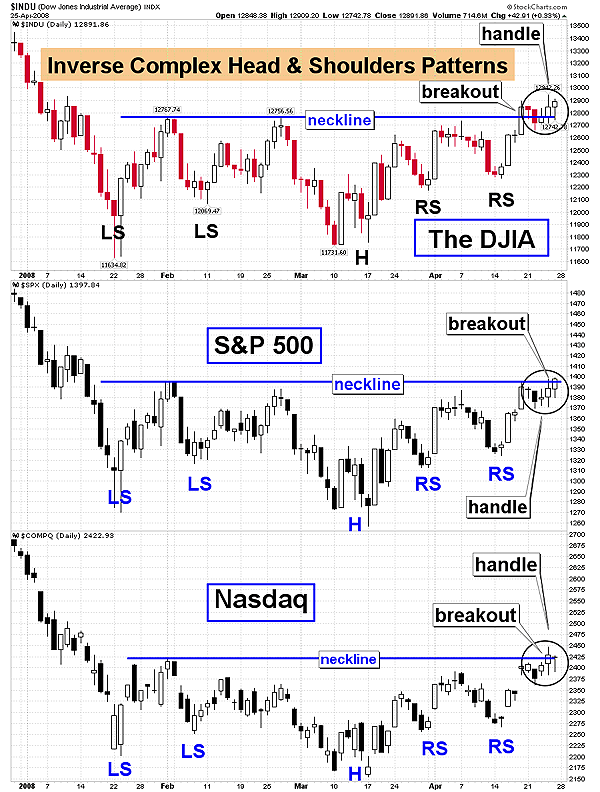
| Recently, I reclassified the Standard & Poor's 500 and the Dow Jones Industrial Average (DJIA) from double bottoms to inverse complex head & shoulders patterns. This was largely because I felt that the first right shoulder was part of the head formation, and I was anticipating a reaction to occur on the indexes at overhead resistance. They still meet the double-bottom criteria, but they possessed certain technical attributes that are better suited for an inverse complex H&S pattern. The NASDAQ had already been classified with this same pattern. Ironically, all three major averages, the DJIA, S&P 500, and the NASDAQ broke above their overhead resistance from the February peaks in recent days. This allowed for some handles to form on the indexes inverse complex H&S patterns (Figure 1). Handles often form on patterns such as triangles, rectangles cups, and so on. The handles can be short, going sideways for approximately five or six trading sessions, or they can be long taking two or three weeks to fully develop. A cup with handle pattern can carve out a much larger handle, taking multiple weeks to form. |

|
| FIGURE 1: $INDU, $SPX, $NASDAQ, DAILY. The major averages have broken out inverse complex head & shoulders patterns in the daily time frame. Currently, each of the averages above have formed handles. Handles form on many patterns to shake out weak longs, while building momentum before the advance resumes. |
| Graphic provided by: StockCharts.com. |
| |
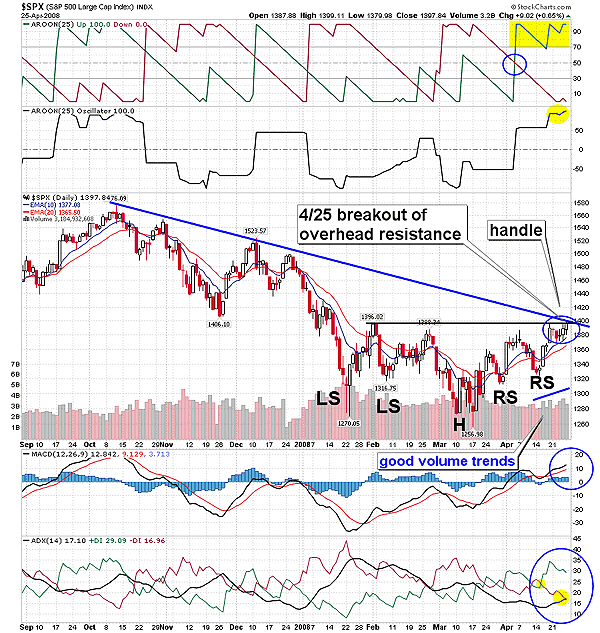
| In Figure 2, each of the patterns managed to move above overhead resistance that formed in early February, but the advance stopped just short of breaking above their long-term intermediate trendlines. Thousands of S&P traders are watching this crucial area of resistance to see if prices will rally above the intermediate downward trendline. If a breakout occurs the previous trend will lose its authority, marking the birth or a new upward trend. This rise to resistance was characterized in the S&P 500 by some positive occupancies in three trend-based indicators, the moving average convergence/divergence (MACD) (12, 26, 9), the aroon (25), and the average directional movement index (ADX) (14). The MACD (12,26, 9) got a bullish cross shortly after the March low, with positive divergence in place. Then during the early stages of the rally, the aroon up crossed above the aroon down, on its way to a healthy move above the value of 70. Later in the rally on April 16, the positive directional index (+DI) moved above the negative directional index (-DI). This allow prices to rise in a stealth move, that increased momentum to the upside. |

|
| FIGURE 2: S&P 500, DAILY. The inverse complex head & shoulders pattern on S&P 500 allowed prices to break above overhead resistance. The bullish trend-based indicators suggest that prices will break above the intermediate downward trend next. On April 25, the ADX crossed above the -DI line, giving birth to a new rising trend. |
| Graphic provided by: StockCharts.com. |
| |
| The moving average convergence/divergence (MACD) has bolstered higher, rising above its last peak. On April 25, the ADX (14) crossed above -DI on the S&P 500 daily chart (Figure 2). This occurred with +DI above both lines, indicating a colossal shift in sentiment favoring the bulls. In addition, just prior to this collision, the S&P 500 and the ADX moved four steps off its low. The ADX put in a bottom reading of 13.05 during the last reaction, and then on April 25, the ADX rallied four steps higher to 17.10. When the ADX rallies four steps off its low, being below both DI lines, it signals that an intermediate bottom has been seen and that a new bull market is emerging. In this case, the +DI was on top when the signal occurred, marking that a long position should be taken. The best time to be long is when both +DI and the ADX lines are above the -DI line. Meanwhile, the aroon (25) has signaled that a powerful trend is under construction, as the aroon upline moved above extreme levels (higher than 70), moving sideways in a lateral range, while the aroon down remained below the value of 30. I like to use the aroon oscillator with it, to measure the strength of the trend. This rally is the first time the aroon oscillator has managed to rise above the value of +50 since the October high, adding validity to the trend. |
| In the weekly time frame, the DJIA and the NASDAQ are currently backtesting their major trendlines, which broke last January. If prices move significantly above the trendlines, they will lose their authority. The weekly S&P 500 chart continues to have favorable conditions. Recently on the S&P 500 weekly chart, the MACD crossed above its signal line and is now recycling upward. The MACD histogram continues to have a rising slope, and moved above the zero line and the stochastic is rising toward 80. The indexes' weekly charts are extremely bullish at these levels, and we are poised for a rally that could last for the next six months. The market continues to show signs of life, rising while it shrugs off bad news. |
| I've been following the a recent news story about John Darwin, who was a canoeist who faked his own death. He and his wife committed insurance fraud, after which he went into hiding in Panama. Darwin previously claimed he had amnesia for the past five years, but has since pled guilty to the charges laid against him. If he is found guilty he could face up to 10 years in prison. Darwin was presumed to be dead, but has now reemerged, being very much alive. John Darwin is as alive as this market is. The bull market is not dead, nor is this a bear market. This bull market was only faking its own death, perpetrating fraud against those who are short, and betting against this market. Who will ultimately pay the price for this deception? |
Ron Walker is an active trader and technical analyst. He operates an educational website dedicated to the study of Technical Analysis. The website offers free market analysis with daily video presentations and written commentaries. Ron is a video pioneer, being one of the first to utilize the internet producing Technical Analysis videos. His website is thechartpatterntrader.com
| Website: | thechartpatterntrader.com |
| E-mail address: | thechartpatterntrader@gmail.com |
Click here for more information about our publications!
Comments
Date: 05/07/08Rank: 5Comment:

Request Information From Our Sponsors
- VectorVest, Inc.
- Executive Premier Workshop
- One-Day Options Course
- OptionsPro
- Retirement Income Workshop
- Sure-Fire Trading Systems (VectorVest, Inc.)
- Trading as a Business Workshop
- VectorVest 7 EOD
- VectorVest 7 RealTime/IntraDay
- VectorVest AutoTester
- VectorVest Educational Services
- VectorVest OnLine
- VectorVest Options Analyzer
- VectorVest ProGraphics v6.0
- VectorVest ProTrader 7
- VectorVest RealTime Derby Tool
- VectorVest Simulator
- VectorVest Variator
- VectorVest Watchdog
- StockCharts.com, Inc.
- Candle Patterns
- Candlestick Charting Explained
- Intermarket Technical Analysis
- John Murphy on Chart Analysis
- John Murphy's Chart Pattern Recognition
- John Murphy's Market Message
- MurphyExplainsMarketAnalysis-Intermarket Analysis
- MurphyExplainsMarketAnalysis-Visual Analysis
- StockCharts.com
- Technical Analysis of the Financial Markets
- The Visual Investor
