HOT TOPICS LIST
- MACD
- Fibonacci
- RSI
- Gann
- ADXR
- Stochastics
- Volume
- Triangles
- Futures
- Cycles
- Volatility
- ZIGZAG
- MESA
- Retracement
- Aroon
INDICATORS LIST
LIST OF TOPICS
PRINT THIS ARTICLE
by Ron Walker
Chinese stocks have been under enormous pressure since October, declining by almost 50% as represented on the Shanghai Composite Index ($SSEC). But could tax relief on equity trading stop the Chinese stock market from bleeding? The answer may be found on the popular electronically traded fund FXI.
Position: N/A
Ron Walker
Ron Walker is an active trader and technical analyst. He operates an educational website dedicated to the study of Technical Analysis. The website offers free market analysis with daily video presentations and written commentaries. Ron is a video pioneer, being one of the first to utilize the internet producing Technical Analysis videos. His website is thechartpatterntrader.com
PRINT THIS ARTICLE
BREAKOUTS
FXI Surges As China Axes A Tax
04/30/08 10:09:52 AMby Ron Walker
Chinese stocks have been under enormous pressure since October, declining by almost 50% as represented on the Shanghai Composite Index ($SSEC). But could tax relief on equity trading stop the Chinese stock market from bleeding? The answer may be found on the popular electronically traded fund FXI.
Position: N/A
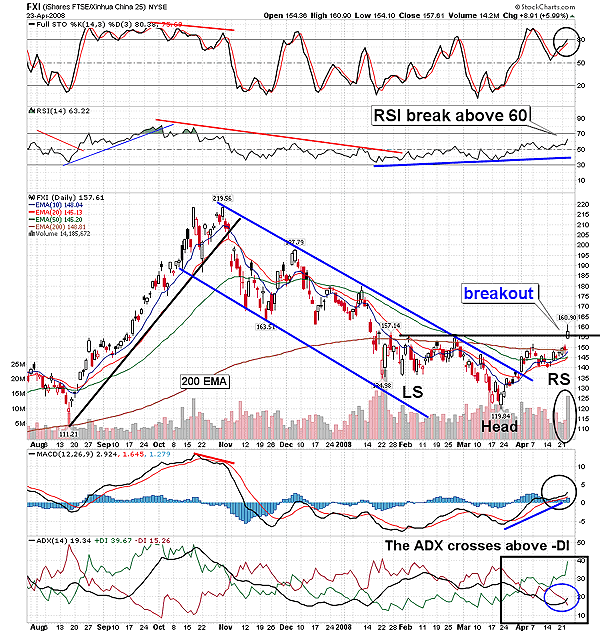
| During the sharp selloff from October to March, FXI (iShares FTSE/Xinaua China 25) declined by almost 50% in less than six months (Figure 1). FXI is an exchange traded fund (ETF) that represents the performance of the largest companies in the China equity market. Support was established near 120 as many world markets found a bottom in March. The upside move was marked by a bullish cross of the moving average convergence/divergence (MACD) (12, 26, 9) and an oversold stochastic (14, 3, 3) with positive divergence preceding the move. The positive directional index (+DI) soared, pulling above the negative directional index (-DI) just as FXI was breaking its downtrend. By the first day in April, the rally had pushed prices above the intermediate downward trendline, ascending above the 50-day exponential moving average (EMA). This bullish strength caused the10-day EMA to move above the 20-day EMA. However, the advance found resistance at the 200-day EMA as the stochastic (14) reinforced short-term bearish sentiment by crossing below its signal line and tipping lower out of overbought territory. This caused prices to suffer a reaction, as they under went a volatile period to test the recent breakout of the downward trendline. |

|
| FIGURE 1: FXI, DAILY. On April 23, prices broke above overhead resistance on huge volume. That coincided with the bullish cross of the ADX rising above the negative directional index (-DI). The MACD also rose with positive divergence in place. |
| Graphic provided by: StockCharts.com. |
| |
| As prices underwent a reaction, they did not go down through the trendline, having been contained at the 20-day EMA. Therefore, the trendline maintained its authority as prices bounced off of the 20-day EMA as seen in Figure 1. Once the reaction concluded, positive divergence developed on the MACD as prices rose to test overhead resistance near 155.50. With the advance under way again, the stochastic (14, 3, 3) got a bullish cross and began to recycle back up on its way to previous highs. The relative strength index (RSI) (14) has also formed multiple points of long-term positive divergence, which is a characteristic that occurs on the RSI just before a change in trend occurs. The fast recovery caused prices to once again rise to test the 200-day EMA. Then on April 23, the ETF flexed is muscles once again, as prices gapped up and rose by a whopping 5.99%. This price surge allowed FXI to break above overhead resistance near 155.50, producing a one-day gain of $8.91. The breakout was sustained by a dramatic increase in volume. In addition, prices broke out of an inverse head & shoulders pattern, with its neckline being at the 155.50 level. |
| This breakout caused several bullish repercussions to transpire that day. The RSI (14) managed to exceed its previous high, finding strength above the 60 level for the first time since the October highs. The MACD forcefully moved above zero-line support, and the average directional movement index (ADX) (14) pushed above the -DI as it was coming off its low point under 20. This event is synchronized with the +DI line being significantly above the other two lines, suggesting the birth of a new upward trend. At present, we are also witnessing a bullish realignment of the 10-, 20-, and 50-day EMAs (Figure 1). A trend is considered to be established once the 10- and 20-day EMA move above the 50-day EMA. Further, it would be extremely bullish if the 50-day EMA crossed above the 200-day. |

|
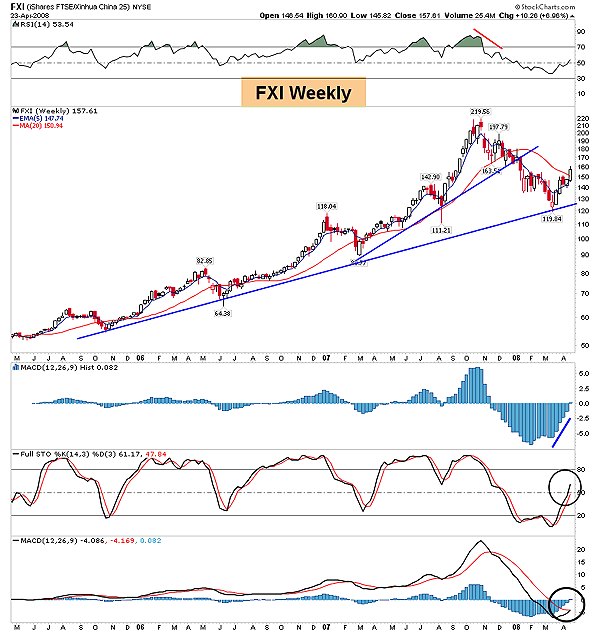
| FIGURE 2: FXI, WEEKLY. The bulls had many positive signs on the weekly FXI chart. The MACD got a bullish touch, as the RSI and stochastic climbed back above 50. The MACD histogram has a rising slope that has now moved above the zero line. |
| Graphic provided by: StockCharts.com. |
| |
| As FXI embarks on its new upward journey, there will be some resistance at the 163 level. But once prices exceed that level, there is not much in the way of resistance until 180. Higher prices appear to be a foregone conclusion on the daily chart, considering the positive signs on the trend-based indicators in conjunction with the recent break above the declining trendline and the move above overhead resistance. The FXI weekly chart (Figure 2) should further encourage the bulls, as the MACD histogram has a rising slope, as this week's bar has moved above the zero line, while the MACD has gotten a bullish touch to the signal line. The RSI (14) and stochastic (14, 3, 3) revealed additional reasons to be positive as both indicators rose above the value of 50, which gives prices the momentum going forward. Incidentally, the jump in Chinese stocks came on the heels of an announcement by the Chinese government late on April 23 that it would be cutting a stamp tax on equity trading from 0.3% to 0.1%, subsequently reversing the move made last May. Moreover, the Shanghai Composite Index ($SSEC), which also declined almost 50% since October, catapulted by over 9% at the open on April 24. |
Ron Walker is an active trader and technical analyst. He operates an educational website dedicated to the study of Technical Analysis. The website offers free market analysis with daily video presentations and written commentaries. Ron is a video pioneer, being one of the first to utilize the internet producing Technical Analysis videos. His website is thechartpatterntrader.com
| Website: | thechartpatterntrader.com |
| E-mail address: | thechartpatterntrader@gmail.com |
Click here for more information about our publications!
PRINT THIS ARTICLE

Request Information From Our Sponsors
- StockCharts.com, Inc.
- Candle Patterns
- Candlestick Charting Explained
- Intermarket Technical Analysis
- John Murphy on Chart Analysis
- John Murphy's Chart Pattern Recognition
- John Murphy's Market Message
- MurphyExplainsMarketAnalysis-Intermarket Analysis
- MurphyExplainsMarketAnalysis-Visual Analysis
- StockCharts.com
- Technical Analysis of the Financial Markets
- The Visual Investor
- VectorVest, Inc.
- Executive Premier Workshop
- One-Day Options Course
- OptionsPro
- Retirement Income Workshop
- Sure-Fire Trading Systems (VectorVest, Inc.)
- Trading as a Business Workshop
- VectorVest 7 EOD
- VectorVest 7 RealTime/IntraDay
- VectorVest AutoTester
- VectorVest Educational Services
- VectorVest OnLine
- VectorVest Options Analyzer
- VectorVest ProGraphics v6.0
- VectorVest ProTrader 7
- VectorVest RealTime Derby Tool
- VectorVest Simulator
- VectorVest Variator
- VectorVest Watchdog
