HOT TOPICS LIST
- MACD
- Fibonacci
- RSI
- Gann
- ADXR
- Stochastics
- Volume
- Triangles
- Futures
- Cycles
- Volatility
- ZIGZAG
- MESA
- Retracement
- Aroon
INDICATORS LIST
LIST OF TOPICS
PRINT THIS ARTICLE
by Koos van der Merwe
An Elliott wave count of the Dow Jones Industrial Average suggests the worst is over, but what does the Standard & Poor's 100 say?
Position: N/A
Koos van der Merwe
Has been a technical analyst since 1969, and has worked as a futures and options trader with First Financial Futures in Johannesburg, South Africa.
PRINT THIS ARTICLE
ELLIOTT WAVE
When In Doubt, Stay Out
04/29/08 08:30:38 AMby Koos van der Merwe
An Elliott wave count of the Dow Jones Industrial Average suggests the worst is over, but what does the Standard & Poor's 100 say?
Position: N/A
| The Dow Jones Industrial Average (DJIA) is made up of 30 companies. The S&P 100 is an index of 100 companies. Why do the two give me different wave counts? Is it because the makeup of the DJIA changed recently? |

|
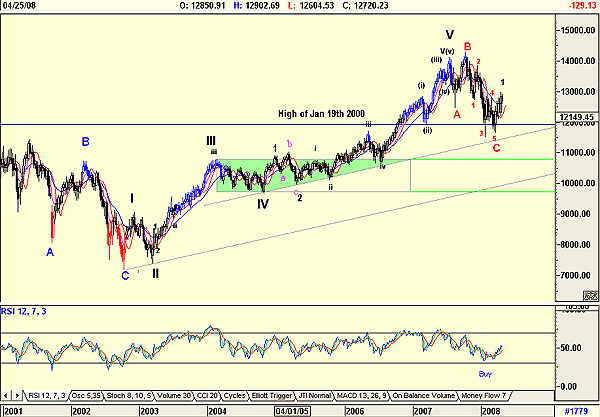
| FIGURE 1: DJIA, WEEKLY. A weekly chart of the DJIA suggests an upward correction of strength. |
| Graphic provided by: AdvancedGET. |
| |
| Figure 1 is a weekly chart of the DJIA. The chart shows how the DJIA completed a fifth wave high and retraced to find support on the high reached on January 19, 2000. An Elliott wave count shows that the DJIA may have completed its C-wave correction, and that it has now started on a new bull wave, with wave 1. The only problem is the first rule of Elliott wave theory, namely that the count must be right. This means that wave 5 should end within the fourth wave of lesser degree. This is shown on the chart as being the area between the two horizontal green lines. A further possible conundrum is created by the relative strength index (RSI), which is suggesting a buy signal. |

|
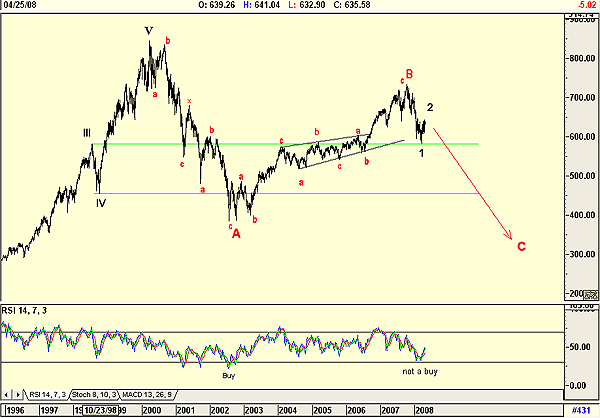
| FIGURE 2: S&P 100, WEEKLY. A weekly chart of the S&P 100 suggests further weakness. |
| Graphic provided by: AdvancedGET. |
| |
| Figure 2 is that of a weekly wave count of the S&P 100. This chart is suggesting that where the wave count shown on the DJIA chart (Figure 1) is a wave C, it could in fact only be a wave 1 of a five-wave C count down and that the present trend is a wave 2 up. The RSI is also suggesting that a buy signal has not been given because the indicator has not fallen below the 32 horizontal level. The chart also shows that the present trend is a wave 2 up. Wave 2s can be either simple or complex, and with the present climate of financial impudence among banks still appearing almost weekly, it looks very possible that the wave 2 will be complex. |
| Both charts are extremely complex, with wave counts that can be confusing. One thing is loud and clear: the immediate short-term trend is up, whether this is a suckers' rally, or a genuine bull trend will show itself in the next few weeks. In the meantime, I would suggest that we use the rally to sell into strength. The maxim is, When in doubt, stay out. |
Has been a technical analyst since 1969, and has worked as a futures and options trader with First Financial Futures in Johannesburg, South Africa.
| Address: | 3256 West 24th Ave |
| Vancouver, BC | |
| Phone # for sales: | 6042634214 |
| E-mail address: | petroosp@gmail.com |
Click here for more information about our publications!
PRINT THIS ARTICLE

Request Information From Our Sponsors
- VectorVest, Inc.
- Executive Premier Workshop
- One-Day Options Course
- OptionsPro
- Retirement Income Workshop
- Sure-Fire Trading Systems (VectorVest, Inc.)
- Trading as a Business Workshop
- VectorVest 7 EOD
- VectorVest 7 RealTime/IntraDay
- VectorVest AutoTester
- VectorVest Educational Services
- VectorVest OnLine
- VectorVest Options Analyzer
- VectorVest ProGraphics v6.0
- VectorVest ProTrader 7
- VectorVest RealTime Derby Tool
- VectorVest Simulator
- VectorVest Variator
- VectorVest Watchdog
- StockCharts.com, Inc.
- Candle Patterns
- Candlestick Charting Explained
- Intermarket Technical Analysis
- John Murphy on Chart Analysis
- John Murphy's Chart Pattern Recognition
- John Murphy's Market Message
- MurphyExplainsMarketAnalysis-Intermarket Analysis
- MurphyExplainsMarketAnalysis-Visual Analysis
- StockCharts.com
- Technical Analysis of the Financial Markets
- The Visual Investor
