HOT TOPICS LIST
- MACD
- Fibonacci
- RSI
- Gann
- ADXR
- Stochastics
- Volume
- Triangles
- Futures
- Cycles
- Volatility
- ZIGZAG
- MESA
- Retracement
- Aroon
INDICATORS LIST
LIST OF TOPICS
PRINT THIS ARTICLE
by Chaitali Mohile
The index has reach its historical resistance, which has till now restricted the upward path. The index is still too weak to violate the stronger resistance.
Position: N/A
Chaitali Mohile
Active trader in the Indian stock markets since 2003 and a full-time writer. Trading is largely based upon technical analysis.
PRINT THIS ARTICLE
SUPPORT & RESISTANCE
Computer Hardware Index Back To Resistance
05/29/08 09:08:46 AMby Chaitali Mohile
The index has reach its historical resistance, which has till now restricted the upward path. The index is still too weak to violate the stronger resistance.
Position: N/A
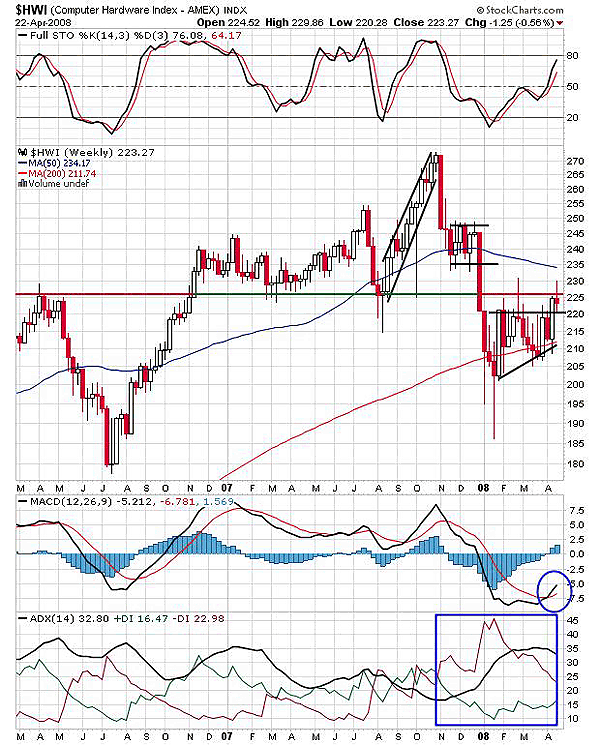
| The Computer Hardware Index ($HWI) surged from the support level of 180 supported by a bullish note by stochastic (14,3,3) and bullish crossover by the moving average convergence/divergence (MACD) (12,26,9). An oversold stochastic fueled the rally, and the index reached its previous high resistance that had earlier pushed the index to lows. This time, the situation was more favorable to carry the move higher and the bulls were stronger than before. The index thus violated the resistance and new support was formed. After this long journey, the index consolidated near a newly formed support area before rallying. |
| The consolidation was relatively healthy and gave birth to a further bullish rally. The index hit 270 in a short period. As the move was steep and lopsided, the continuity of the rally was eyed with caution. The stochastic has already reached its overbought area. In addition, the MACD (12,26,9) was jittery in positive territory so some weakness was in the cards. The uptrend that was building along with buying pressure soon was grabbed by a bearish force, and eventually, the index plunged below the newly supported area. Half the gains on an earlier bullish rally, from 225 to 270, were lost in one single week. The index consolidated after this nosedive, forming a bearish flag & pennant pattern. The pattern soon broke down and again 225 was turned down as a resistance area. In Figure 1, the horizontal line is again red, indicating the resistance area. |

|
| FIGURE 1: $HWI, WEEKLY. The second bearish flag & pennant downside breakout looks difficult. But a breakout in an upward direction would see the immediate resistance of 225 and the pattern would fail too. |
| Graphic provided by: StockCharts.com. |
| |
| Later on, the index moved within a wide range of 205 to 220 (since the beginning of 2008). The lower range was converging while the upper range was more stable. A second bearish flag & pennant pattern was formed. The pattern failure by an upside breakout was unexpected, and the 225 stands as an immediate resistance. In the past week, when the entire US financial market was undergoing a bullish rally, $HWI also tried to break upward and converted the 225 resistance to support. But the long upper and lower shadow shows the weakness on the extreme side of the rally. All three indicators show positive signs for an upside move, so the index may move within a narrower range of 220-225 for some time. A downside breakout on a second bearish flag & pennant seems unlikely, but then again, but the index currently does not have the strength to rally higher. |

|
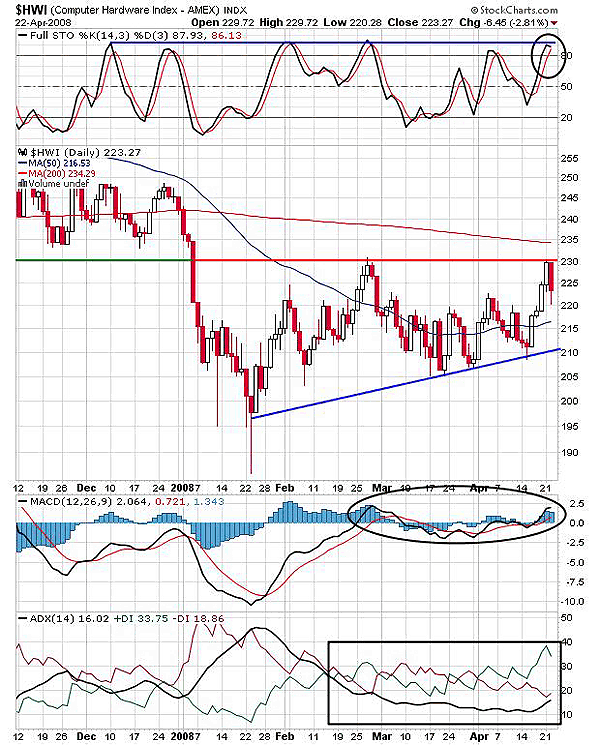
| FIGURE 2: $HWI, DAILY. The index has retraced back from the resistance level. |
| Graphic provided by: StockCharts.com. |
| |
| In Figure 2 you can see that recently, the index showed a good bullish rally toward resistance but the stochastic shows no signs of rising higher. The MACD (12,26,9) has a very shaky move near the trigger line, indicating high volatility. The ADX (14) above 15 indicated a possible consolidation. Above all, the close on April 22, 2008, was compressed by the resistance. Though higher lows are formed, the index was not strong enough to move ahead of 225. |
| Thus, the overall scenario suggests that $HWI may still remain under the dark shadows of its historical resistance. |
Active trader in the Indian stock markets since 2003 and a full-time writer. Trading is largely based upon technical analysis.
| Company: | Independent |
| Address: | C1/3 Parth Indraprasth Towers. Vastrapur |
| Ahmedabad, Guj 380015 | |
| E-mail address: | chaitalimohile@yahoo.co.in |
Traders' Resource Links | |
| Independent has not added any product or service information to TRADERS' RESOURCE. | |
Click here for more information about our publications!
Comments

|

Request Information From Our Sponsors
- StockCharts.com, Inc.
- Candle Patterns
- Candlestick Charting Explained
- Intermarket Technical Analysis
- John Murphy on Chart Analysis
- John Murphy's Chart Pattern Recognition
- John Murphy's Market Message
- MurphyExplainsMarketAnalysis-Intermarket Analysis
- MurphyExplainsMarketAnalysis-Visual Analysis
- StockCharts.com
- Technical Analysis of the Financial Markets
- The Visual Investor
- VectorVest, Inc.
- Executive Premier Workshop
- One-Day Options Course
- OptionsPro
- Retirement Income Workshop
- Sure-Fire Trading Systems (VectorVest, Inc.)
- Trading as a Business Workshop
- VectorVest 7 EOD
- VectorVest 7 RealTime/IntraDay
- VectorVest AutoTester
- VectorVest Educational Services
- VectorVest OnLine
- VectorVest Options Analyzer
- VectorVest ProGraphics v6.0
- VectorVest ProTrader 7
- VectorVest RealTime Derby Tool
- VectorVest Simulator
- VectorVest Variator
- VectorVest Watchdog
