HOT TOPICS LIST
- MACD
- Fibonacci
- RSI
- Gann
- ADXR
- Stochastics
- Volume
- Triangles
- Futures
- Cycles
- Volatility
- ZIGZAG
- MESA
- Retracement
- Aroon
INDICATORS LIST
LIST OF TOPICS
PRINT THIS ARTICLE
by Chaitali Mohile
Certain patterns and rallies indicate declining bearish force. Will the EWH really break through the resistance to begin a fresh bullish run?
Position: N/A
Chaitali Mohile
Active trader in the Indian stock markets since 2003 and a full-time writer. Trading is largely based upon technical analysis.
PRINT THIS ARTICLE
HEAD & SHOULDERS
Is HongKong iShares Coming Out Of Bearish Phase?
05/29/08 09:45:21 AMby Chaitali Mohile
Certain patterns and rallies indicate declining bearish force. Will the EWH really break through the resistance to begin a fresh bullish run?
Position: N/A
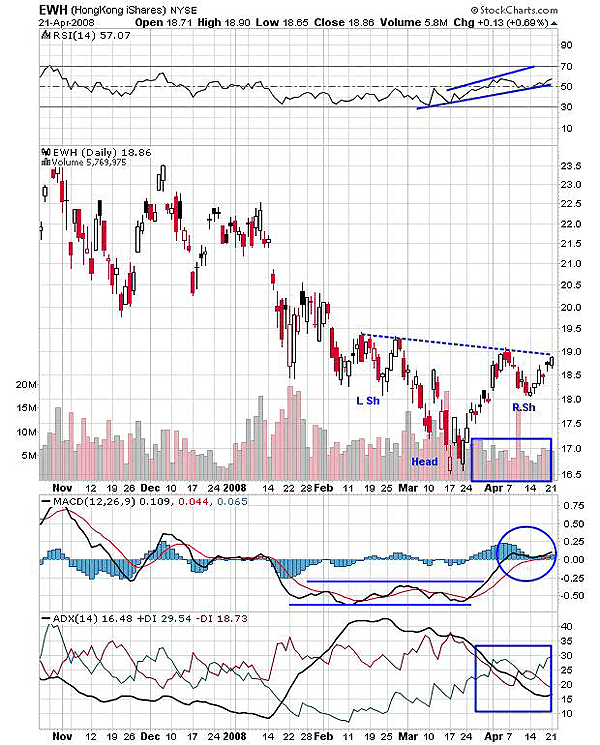
| The robust uptrend turned weaker from November 2007, according to Figure 1. EWH slumped from 23.5 to 16.5 in six to seven months. The declining rally also had huge gaps down that hurriedly touched the lower levels. The bearish trend was soon in action, which later became stronger as the price touched lower lows. The relative strength index (RSI) (14) touched 30 and the moving average convergence/divergence (MACD) (12,26,9) was also dragged into negative territory. |
| By mid-March 2008, the downtrend overheated and began declining while the price formed a base at 16.5. Thus, the upside was born and the EWH surged toward the first resistance at the 19 level. While this resistance level was tested and retested for the fourth consecutive time, an inverted head & shoulders pattern was formed with a neckline that is at the 19 level. The inverted head & shoulders is a bullish reversal pattern that is typically seen in a downtrend. This reversal pattern indicates the beginning of a bullish rally if price breaks out above the neckline. As of now, volume is not so encouraging, but a breakout may bring in a sudden growth in volume. The RSI, MACD are also turning bullish, which could support a breakout in the near future. See Figure 1. |

|
| FIGURE 1: EWH, DAILY. This chart shows an inverted head & shoulders pattern. On breakout the downtrend would turn to uptrend and a new bullish rally would begin. |
| Graphic provided by: StockCharts.com. |
| |
| The positive directional index (+DI) has turned heavier than the negative directional index (-DI) and the average directional movement index (ADX) (14) has moved above 15, indicating a healthy bullish consolidation under way. The MACD (12,26,9) is back in positive territory, adding confidence amongst traders. Meanwhile, the RSI (14) has established support at 50 levels and looks like it is ready for a further bullish move. Some bottom formation is seen among the indicators, which enhance the possibility of a bullish breakout. But traders should wait for a breakout confirmation that sustains above the neckline support before initiating any long positions. But overall, EWH is ready to resume its fresh rally after a long time. |

|
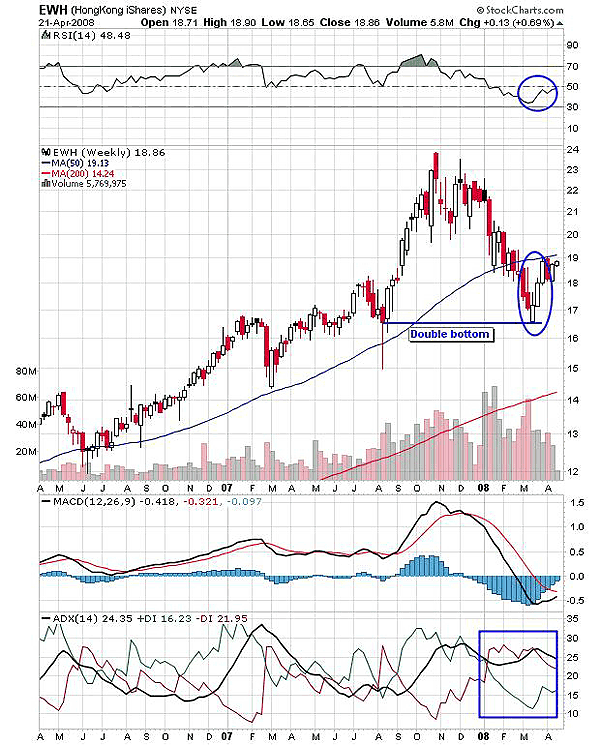
| FIGURE 2: EWH, WEEKLY. |
| Graphic provided by: StockCharts.com. |
| |
| In Figure 2, you can see that after breaking below the 50-day moving average, EWH rallied back up to the moving average and then retraced. But the correction was not severe enough to hurt any trading positions. But a breakout above this resistance would indicate a robust rally ahead. EWH is again ready to approach the resistance for the second time. The indicators are more bullish this time than earlier. The -DI is declining, whereas increasing in buying pressure is seen by +DI running upward. Again, the RSI (14) has moved vertically toward the golden level of 50. And the MACD (12,26,9), though still in negative territory, shows the bullish interest to move ahead of zero line, thus violating the 50-day MA resistance would bring back the bullish sentiment. |

|
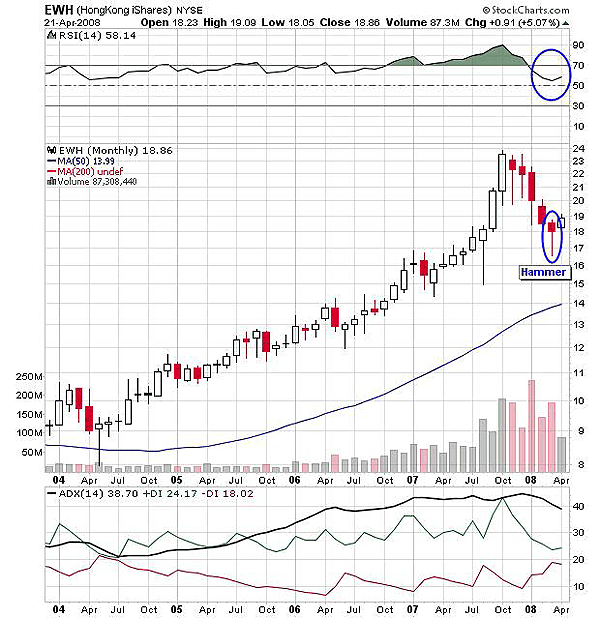
| FIGURE 3, MONTHLY. The downtrend is hammered by the hammer candlestick pattern. Thus, the fresh rally is likely to begin. |
| Graphic provided by: StockCharts.com. |
| |
| A short note about the monthly chart to add confidence among traders: The chart has formed a hammer candlestick pattern. The hammer candle is a bullish reversal pattern that suggests an end to the downtrend (hammers the downtrend) and the start of a new uptrend. The long-term uptrend is very well maintained by a marginal decline from the overheated levels. In addition, the RSI (14) has a U-turn within the bullish area. So the hammer along with positive indicators on the chart is indicating a new beginning for bullish traders. Thus, EWH will soon have bright days ahead on confirming breakouts from the resistance. |
Active trader in the Indian stock markets since 2003 and a full-time writer. Trading is largely based upon technical analysis.
| Company: | Independent |
| Address: | C1/3 Parth Indraprasth Towers. Vastrapur |
| Ahmedabad, Guj 380015 | |
| E-mail address: | chaitalimohile@yahoo.co.in |
Traders' Resource Links | |
| Independent has not added any product or service information to TRADERS' RESOURCE. | |
Click here for more information about our publications!
Comments
Date: 06/03/08Rank: 5Comment:

Request Information From Our Sponsors
- StockCharts.com, Inc.
- Candle Patterns
- Candlestick Charting Explained
- Intermarket Technical Analysis
- John Murphy on Chart Analysis
- John Murphy's Chart Pattern Recognition
- John Murphy's Market Message
- MurphyExplainsMarketAnalysis-Intermarket Analysis
- MurphyExplainsMarketAnalysis-Visual Analysis
- StockCharts.com
- Technical Analysis of the Financial Markets
- The Visual Investor
- VectorVest, Inc.
- Executive Premier Workshop
- One-Day Options Course
- OptionsPro
- Retirement Income Workshop
- Sure-Fire Trading Systems (VectorVest, Inc.)
- Trading as a Business Workshop
- VectorVest 7 EOD
- VectorVest 7 RealTime/IntraDay
- VectorVest AutoTester
- VectorVest Educational Services
- VectorVest OnLine
- VectorVest Options Analyzer
- VectorVest ProGraphics v6.0
- VectorVest ProTrader 7
- VectorVest RealTime Derby Tool
- VectorVest Simulator
- VectorVest Variator
- VectorVest Watchdog
