HOT TOPICS LIST
- MACD
- Fibonacci
- RSI
- Gann
- ADXR
- Stochastics
- Volume
- Triangles
- Futures
- Cycles
- Volatility
- ZIGZAG
- MESA
- Retracement
- Aroon
INDICATORS LIST
LIST OF TOPICS
PRINT THIS ARTICLE
by Chaitali Mohile
Ford Motor has a strong breakout from various support/resistance areas, forming a strong bottom. The flag & pennant breakout offers a good trading opportunity.
Position: Buy
Chaitali Mohile
Active trader in the Indian stock markets since 2003 and a full-time writer. Trading is largely based upon technical analysis.
PRINT THIS ARTICLE
TECHNICAL ANALYSIS
Ford Motor In Upper Gear
05/28/08 09:00:35 AMby Chaitali Mohile
Ford Motor has a strong breakout from various support/resistance areas, forming a strong bottom. The flag & pennant breakout offers a good trading opportunity.
Position: Buy
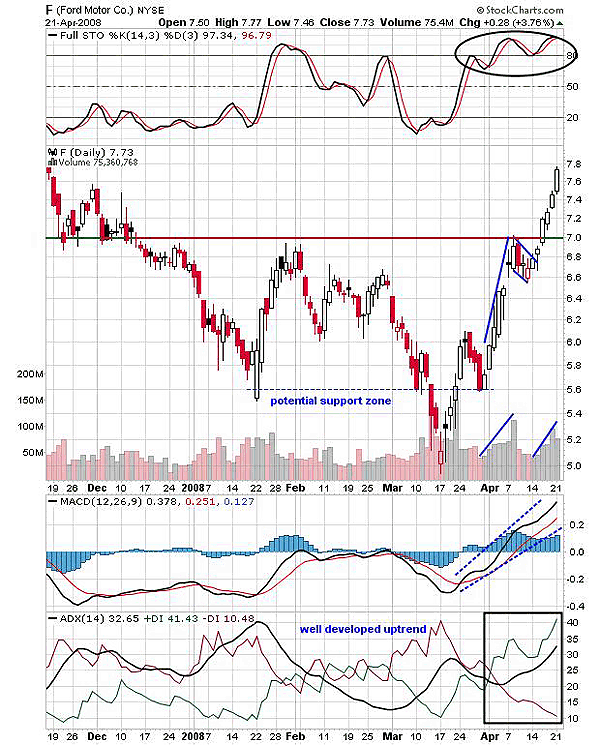
| The bullish rally in Ford Motor (F) began from the lower level at 5, converting earlier resistance of 5.6 to potential support during the journey. The rally retraced back to the support zone, forming the area stronger for future rallies. The stock rallied higher with good volume this time and more bullish signs. After this advance rally, the stock consolidated under the pressure of previous highs, which were now resistance. The horizontal line in Figure 1 indicates the resistance levels (in red) and support level (in green). The stock here formed a bullish flag & pennant continuation pattern, which breaks open in upward direction. |

|
| FIGURE 1: FORD, DAILY. The flag & pennant pattern has already broken out and the rally still shows significant force to run higher. The indicators are equally bullish and positive toward the rally. |
| Graphic provided by: StockCharts.com. |
| |
| The stochastic (14,3,3) and the moving average convergence/divergence (MACD) (12,26,9) were both highly bullish. The stochastic entered overbought territory, attracting more traders, while the MACD (12,26,9) surged in positive territory. The breakout finally occurred in the upper direction toward the rally. The target on the pattern breakout is almost achieved, but the indicators suggest more levels under way. The average directional movement index (ADX) (14) shows a well-developed uptrend, so the rally may continue. At the most, the stock may consolidate and then carry forward the rally. |
| All the white bullish candles indicate full strength in the rally, and the MACD (12,26,9) and the ADX (14) are equally strong to continue the move ahead. The stochastic is highly overbought, and consolidation might be seen. But overall, the stock can be bought at these levels too. |

|
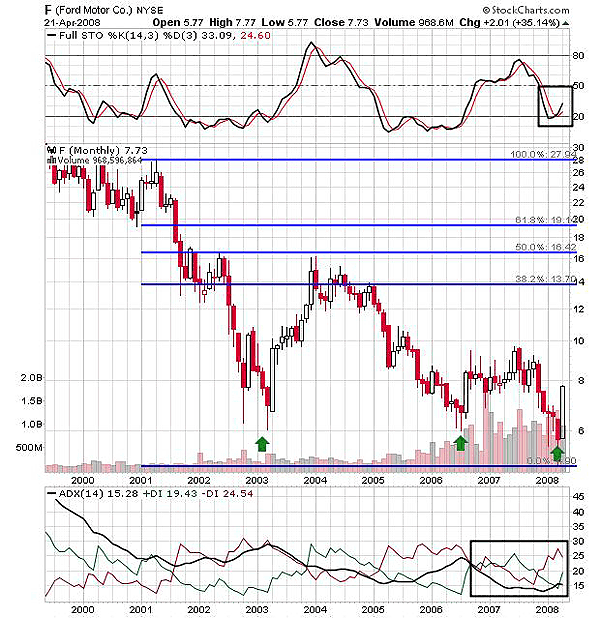
| FIGURE 2: FORD, MONTHLY. The 38.2% retracement level is the hurdle for the bullish rally. On positive grounds in the current year, the same level stands on target in the upcoming rally. |
| Graphic provided by: StockCharts.com. |
| |
| On the monthly chart (Figure 2), after the steep fall from the 30 levels to 6, the 38.2% retracement level has been the strongest resistance for the pullback rally. The recovery that began in 2003 was very slow, low in volume, and deep in downtrend. So the rally was weak to surge higher above the retracement levels. Eventually, the stock plunged to 6 and though a hammer candlestick was formed at this bottom, it failed to move ahead. The ADX (14) by now turned weaker with +DI and -DI tangled. So this pullback was more volatile than earlier. In 2008, the stock is back to 6 and again battling to touch higher levels. The candle for March has closed with the support of 6, and April opened with the same support so the level 6 carries some significance. However, the stochastic (14,3,3) at 20 shows fresh buying opportunities for traders and investors. The ADX (14) has recovered from the weaker levels and is back above 15. Though the trend is not yet developed, we can see increasing buying pressure by rising +DI. |
| Looking at Figure 2's ADX (14) levels, bullish consolidation might be seen. And good trading opportunity can keep coming in for Ford, with initial target of 14 (38.2% retracement level). Thus. the stock is in high spirits to hit the previous levels. |
Active trader in the Indian stock markets since 2003 and a full-time writer. Trading is largely based upon technical analysis.
| Company: | Independent |
| Address: | C1/3 Parth Indraprasth Towers. Vastrapur |
| Ahmedabad, Guj 380015 | |
| E-mail address: | chaitalimohile@yahoo.co.in |
Traders' Resource Links | |
| Independent has not added any product or service information to TRADERS' RESOURCE. | |
Click here for more information about our publications!
Comments
Date: 05/28/08Rank: 5Comment:
Date: 05/28/08Rank: 1Comment:

Request Information From Our Sponsors
- StockCharts.com, Inc.
- Candle Patterns
- Candlestick Charting Explained
- Intermarket Technical Analysis
- John Murphy on Chart Analysis
- John Murphy's Chart Pattern Recognition
- John Murphy's Market Message
- MurphyExplainsMarketAnalysis-Intermarket Analysis
- MurphyExplainsMarketAnalysis-Visual Analysis
- StockCharts.com
- Technical Analysis of the Financial Markets
- The Visual Investor
- VectorVest, Inc.
- Executive Premier Workshop
- One-Day Options Course
- OptionsPro
- Retirement Income Workshop
- Sure-Fire Trading Systems (VectorVest, Inc.)
- Trading as a Business Workshop
- VectorVest 7 EOD
- VectorVest 7 RealTime/IntraDay
- VectorVest AutoTester
- VectorVest Educational Services
- VectorVest OnLine
- VectorVest Options Analyzer
- VectorVest ProGraphics v6.0
- VectorVest ProTrader 7
- VectorVest RealTime Derby Tool
- VectorVest Simulator
- VectorVest Variator
- VectorVest Watchdog
