

HOT TOPICS LIST
- MACD
- Fibonacci
- RSI
- Gann
- ADXR
- Stochastics
- Volume
- Triangles
- Futures
- Cycles
- Volatility
- ZIGZAG
- MESA
- Retracement
- Aroon
INDICATORS LIST
LIST OF TOPICS
PRINT THIS ARTICLE
by Ron Walker
The fan principle can be applied to corrective swings to help determine when an intermediate reaction has concluded. The breaking of the third fan line signals a reversal and that a new uptrend is about to begin.
Position: N/A
Ron Walker
Ron Walker is an active trader and technical analyst. He operates an educational website dedicated to the study of Technical Analysis. The website offers free market analysis with daily video presentations and written commentaries. Ron is a video pioneer, being one of the first to utilize the internet producing Technical Analysis videos. His website is thechartpatterntrader.com
PRINT THIS ARTICLE
FAN LINES
The Fan Principle On The S&P 500
04/21/08 10:05:54 AMby Ron Walker
The fan principle can be applied to corrective swings to help determine when an intermediate reaction has concluded. The breaking of the third fan line signals a reversal and that a new uptrend is about to begin.
Position: N/A
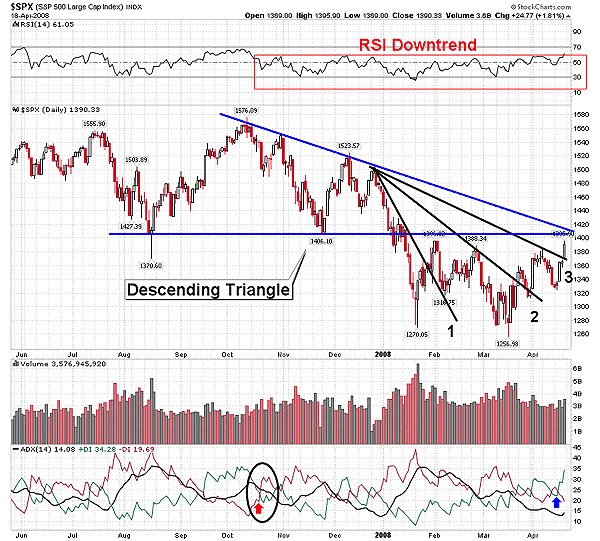
| The daily chart of the Standard & Poor's 500 Index ($SPX) has been in a downtrend since mid-October 2007 (Figure 1). Early weakness was detected on the average directional movement index (ADX) (14), which saw an increase in selling pressure when the -DI crossed above the +DI shortly after the top had been seen on October 9 (Figure 1). Prices suffered a severe correction over the next six months, dropping from an all-time closing high of 1565 to the recent March 10th closing low of 1273. This decline resulted in a loss of 291 points, causing the value of $SPX to drop by 18.65%. If the $SPX were to decline by 20% or more over at least a two-month span of time, it would meet the generally accepted description of a bear market. That means that a bear market would be triggered by a close below 1252 on the S&P 500, which would represent a loss of 313 points. We must not rush to judgment by prematurely calling for a bear market, when the $SPX may only be experiencing a severe correction. |
|
| FIGURE 1: $SPX, DAILY. The three-fan principle is applied after the breakdown of a descending triangle. Since the intermediate downtrend began in October, the relative strength index (RSI) has found resistance at the value of 60. |
| Graphic provided by: StockCharts.com. |
| |
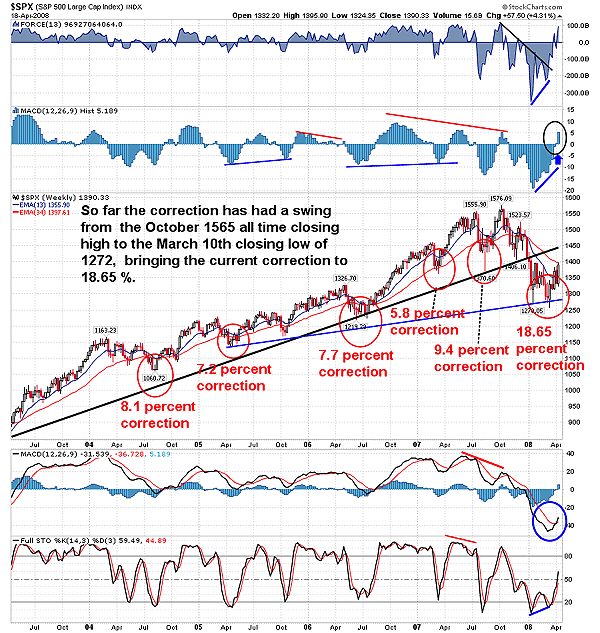
| The $SPX may have suffered from such a dramatic correction this time around due to the housing recession and the credit crisis. But in addition, the steep loss could be predicated on the fact that the preceding corrections that have taken place haven't been too severe as seen on the $SPX weekly chart (Figure 2). Most of the corrections that have occurred since March 2003, when the bull market began, have been between 7% and 8%. How will we know when the correction is over? When a secondary intermediate correction occurs against the major trend, the three-fan line principle can often be applied to determine when a correction is ending. Fan lines can be drawn from rally peaks off of the original reversal point, or they can be drawn from a high, as prices break down from a chart pattern. |
|
| FIGURE 2: $SPX, WEEKLY. This correction has been much more severe that previous corrections during the bull market declined by 18.65%. The high volatility was follow by trepidation in the marketplace. |
| Graphic provided by: StockCharts.com. |
| |
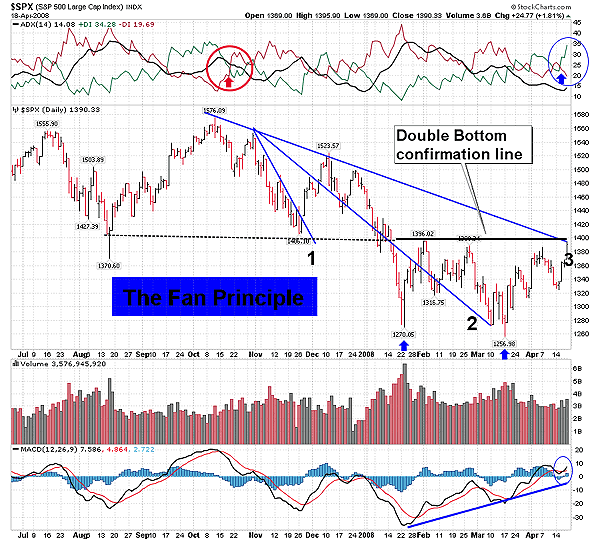
| Figure 1 illustrates the three-fan principle in action, with a valid application of fan lines drawn upon the breakdown of a descending triangle that developed over several months off the October high. The first fan line got a breakout in late January as prices rose to 1396 to backtest the descending triangle, but then shortly fell back to test the first fan line without penetrating it. Prices then surged back up to test resistance again but failed, allowing for a second fan line to emerge. The $SPX then moved lower, testing the January low, which acted as a springboard in order to break the second fan line. This carved out the March bottom. As prices broke out of fan line 2, they quickly backtested the trendline but did not penetrate again. From there, prices rose, forming another peak near overhead resistance, just below the two previous peaks that formed in February. Then after a brief downturn, $SPX moved above the third fan line and immediately climbed to test the lower boundary of the descending triangle. Its horizontal line is near 1406, which serves as key resistance. A break above 1396 would confirm a double-bottom pattern represented by the January and March lows (Figure 3). Note that prices extended sideways in a lateral range upon the initial breakdown of the descending triangle, causing the angle of descent to become gradually flatter and less steep over time. Therefore, this trendline trio was dubbed as the fan line principle, having closely resembled the appearance of a fan. The breaking of the third fan line marks the conclusion of a corrective swing and signals a trend reversal. Penetration above the third fan line is also confirmation that an intermediate bottom has been seen. |
|
| FIGURE 3: $SPX, DAILY. Another application of the three-fan line principle can be applied to the S&P 500 by drawing an initial fan line off the original reversal point. |
| Graphic provided by: StockCharts.com. |
| |
| In Figure 3, another application of the three-fan line principle can be applied to the S&P 500 by drawing an initial fan line off the original reversal point. The first two fan lines in this illustration are drawn from the lower high that transpired at the end of October. Fan line 3 is the intermediate corrective trendline. Upon closer observation, you will see that fan line 3 and the confirmation line of the double-bottom pattern intersect at the apex of the triangle in Figure 3. If prices break out of the double-bottom pattern, it would coincide with the penetration of the intermediate downtrend and move above the apex of the descending triangle. This would be a very bullish event. In addition, if prices get another reaction at resistance, the S&P 500 could set up an inverse head & shoulder pattern of the complex class. But if a breakout occurs, then the double-bottom pattern will prove to be authentic. |
| In the first illustration I used, fan lines were drawn upon the breaking of the descending triangle, already causing the penetration of the third fan line. While in the second example, the breaking of the third fan line has not yet transpired. However, the second example reflected a weaker second fan line, in that it was penetrated as the first bottom caused prices to plunge in January. Accordingly, both illustrations have merit, but more weight may be applied to the second application because the third fan line and the intermediate trendline are interchangeable. Therefore, if prices break above the intermediate corrective trendline (fan line 3), a change in trend would follow. |
Ron Walker is an active trader and technical analyst. He operates an educational website dedicated to the study of Technical Analysis. The website offers free market analysis with daily video presentations and written commentaries. Ron is a video pioneer, being one of the first to utilize the internet producing Technical Analysis videos. His website is thechartpatterntrader.com
| Website: | thechartpatterntrader.com |
| E-mail address: | thechartpatterntrader@gmail.com |
Click here for more information about our publications!
Comments
Date:�04/22/08Rank:�1Comment:�

Request Information From Our Sponsors
- VectorVest, Inc.
- Executive Premier Workshop
- One-Day Options Course
- OptionsPro
- Retirement Income Workshop
- Sure-Fire Trading Systems (VectorVest, Inc.)
- Trading as a Business Workshop
- VectorVest 7 EOD
- VectorVest 7 RealTime/IntraDay
- VectorVest AutoTester
- VectorVest Educational Services
- VectorVest OnLine
- VectorVest Options Analyzer
- VectorVest ProGraphics v6.0
- VectorVest ProTrader 7
- VectorVest RealTime Derby Tool
- VectorVest Simulator
- VectorVest Variator
- VectorVest Watchdog
- StockCharts.com, Inc.
- Candle Patterns
- Candlestick Charting Explained
- Intermarket Technical Analysis
- John Murphy on Chart Analysis
- John Murphy's Chart Pattern Recognition
- John Murphy's Market Message
- MurphyExplainsMarketAnalysis-Intermarket Analysis
- MurphyExplainsMarketAnalysis-Visual Analysis
- StockCharts.com
- Technical Analysis of the Financial Markets
- The Visual Investor