HOT TOPICS LIST
- MACD
- Fibonacci
- RSI
- Gann
- ADXR
- Stochastics
- Volume
- Triangles
- Futures
- Cycles
- Volatility
- ZIGZAG
- MESA
- Retracement
- Aroon
INDICATORS LIST
LIST OF TOPICS
PRINT THIS ARTICLE
by Chaitali Mohile
The Amex Composite may see a major downside with a head & shoulders top reversal pattern. Is the right-shoulder formation complete, or are multiple shoulders getting constructed?
Position: N/A
Chaitali Mohile
Active trader in the Indian stock markets since 2003 and a full-time writer. Trading is largely based upon technical analysis.
PRINT THIS ARTICLE
HEAD & SHOULDERS
Amex Composite Forming Head & Shoulder Top?
05/20/08 05:08:53 PMby Chaitali Mohile
The Amex Composite may see a major downside with a head & shoulders top reversal pattern. Is the right-shoulder formation complete, or are multiple shoulders getting constructed?
Position: N/A
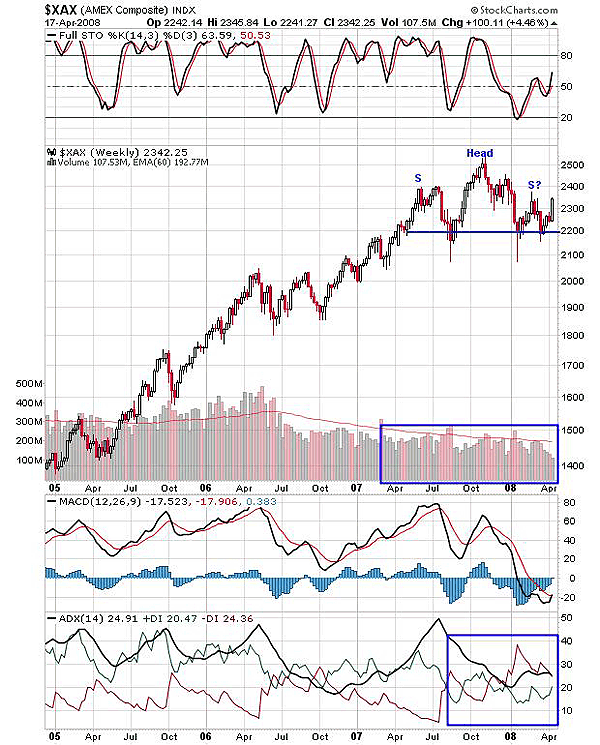
| From the weekly chart of the Amex Composite (Figure 1), you can see that the index has been in a strong uptrend with good trading opportunities for traders and investors. In early 2007 when the index reached the 2400 level, a relatively fast 200-point correction followed. But there was no significant decline in volume reflecting an optimistic view in market. The index recovered equally faster, rallying even higher than the previous level. From the new high, the index again declined toward the 2200 level. |

|
| FIGURE 1: $XAX, WEEKLY |
| Graphic provided by: StockCharts.com. |
| |
| We now have two peaks at two different levels with one support line at 2200. The volume must be noticed here; the first peaks had higher volume than the second peak. Volume was declining probably due to the fear of topping signals. $XAX surged from the support line but failed to make a new high. Instead, it marginally touched 2400 and retraced back to the support line. At that point, the head & shoulders top reversal pattern was much clearer on the chart and the traders were on high alert. Volume was declining and the neckline at 2200 was formed, so the picture was perfect for a reversal pattern. Till the formation of the left shoulder and head, everything seemed normal. |
| As the right shoulder was completed, the index witnessed a bullish rally from the neckline, but on lower volume. So is a multiple right shoulder being formed, or is the pattern a classic head & shoulders top? Either way, a break in the neckline support would bring a serious bearish force and replace the uptrend with a downtrend. I would also like to mention that the pattern might even fail if this particular bullish rally moves higher than second peak (head). |
| The stochastic (14,3,3) is currently flirting around the bullish levels of 50. The moving average convergence/divergence (MACD) (12,26,9) has been dragged into negative territory. The indicator is on the verge of forming a bullish crossover in negative territory. So in the present scenario a strong bullish run would be difficult. Again, as the index plunged from its highest peak (head), the average directional movement index ADX (14) showed bearish pressure and the trend was captured after a long battle, so the possibility of a neckline breakout is much higher. A short position is possible only after the neckline breakout is confirmed with increased volume. The price target can be calculated by measuring the length from the peak of the head to the neckline and subtracting this value from the neckline break. Keep in mind that after the breakout, the price might run back to retest the neckline resistance giving you another opportunity to short a position. |
Active trader in the Indian stock markets since 2003 and a full-time writer. Trading is largely based upon technical analysis.
| Company: | Independent |
| Address: | C1/3 Parth Indraprasth Towers. Vastrapur |
| Ahmedabad, Guj 380015 | |
| E-mail address: | chaitalimohile@yahoo.co.in |
Traders' Resource Links | |
| Independent has not added any product or service information to TRADERS' RESOURCE. | |
Click here for more information about our publications!
PRINT THIS ARTICLE

|

Request Information From Our Sponsors
- StockCharts.com, Inc.
- Candle Patterns
- Candlestick Charting Explained
- Intermarket Technical Analysis
- John Murphy on Chart Analysis
- John Murphy's Chart Pattern Recognition
- John Murphy's Market Message
- MurphyExplainsMarketAnalysis-Intermarket Analysis
- MurphyExplainsMarketAnalysis-Visual Analysis
- StockCharts.com
- Technical Analysis of the Financial Markets
- The Visual Investor
- VectorVest, Inc.
- Executive Premier Workshop
- One-Day Options Course
- OptionsPro
- Retirement Income Workshop
- Sure-Fire Trading Systems (VectorVest, Inc.)
- Trading as a Business Workshop
- VectorVest 7 EOD
- VectorVest 7 RealTime/IntraDay
- VectorVest AutoTester
- VectorVest Educational Services
- VectorVest OnLine
- VectorVest Options Analyzer
- VectorVest ProGraphics v6.0
- VectorVest ProTrader 7
- VectorVest RealTime Derby Tool
- VectorVest Simulator
- VectorVest Variator
- VectorVest Watchdog
