

HOT TOPICS LIST
- MACD
- Fibonacci
- RSI
- Gann
- ADXR
- Stochastics
- Volume
- Triangles
- Futures
- Cycles
- Volatility
- ZIGZAG
- MESA
- Retracement
- Aroon
INDICATORS LIST
LIST OF TOPICS
PRINT THIS ARTICLE
by Koos van der Merwe
Petro Canada is a Canadian oil and gas company with International interests.
Position: Accumulate
Koos van der Merwe
Has been a technical analyst since 1969, and has worked as a futures and options trader with First Financial Futures in Johannesburg, South Africa.
PRINT THIS ARTICLE
FLAGS AND PENNANTS
Playing Oil With Petro Canada
04/21/08 09:44:15 AMby Koos van der Merwe
Petro Canada is a Canadian oil and gas company with International interests.
Position: Accumulate
| Petro Canada is one of Canada's largest oil and gas companies, operating in both upstream and the downstream sectors of the industry in Canada and internationally. The company creates value by responsibly developing energy resources and providing world-class petroleum products and services. Headquartered in Calgary, Alberta, the company employs more than 5,600 employees around the world. Shares trade on the Toronto Stock Exchange under the symbol PCA, and on the New York Stock Exchange under the symbol PCZ. |
|
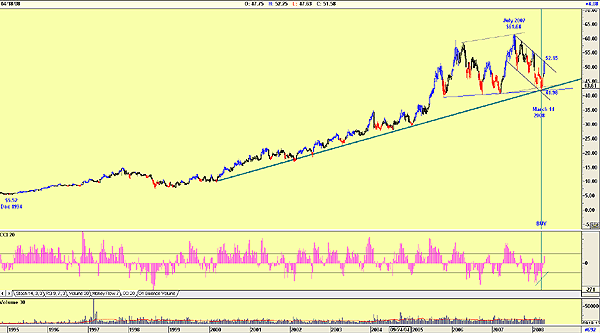
| FIGURE 1: PETROCAN, WEEKLY. This chart shows the strong rise in line with the price of oil. |
| Graphic provided by: AdvancedGET. |
| |
| Figure 1 is a weekly chart that shows how the stock price strengthened from a low of $5.52 in December 1994 to a high of $61.64 in July 2007. The price then dropped to hit the support line at $41.98 by March 14, 2008. At this level, my indicator of choice, a 20-period commodity channel index (CCI), gave a buy signal on divergence. The stock price then rose to test the resistance line at $52.15 as shown. The question is, will this resistance line be broken? For an answer, I turn to a daily chart. |
|
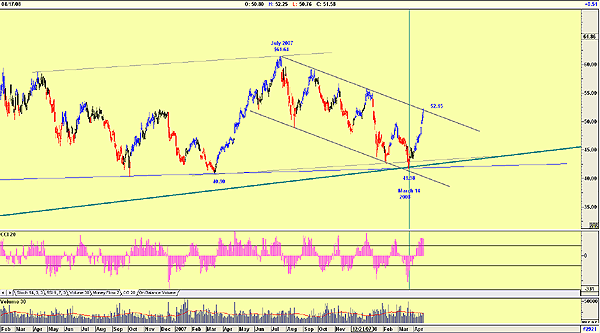
| FIGURE 2: PETROCAN, DAILY. This chart shows the flag formation that has developed. |
| Graphic provided by: AdvancedGET. |
| |
| Figure 2 shows the flag formation seen in the weekly chart, with the price testing the upper resistance line at $52.15. But where the CCI on the weekly chart suggested further strength, the CCI on the daily chart has given or could soon be giving a sell signal. This is confirmed by the volume, which has fallen as the price has risen. Rising price + falling volume = weakness. Does this suggest that the oil price will start falling? Possibly, for the short term only. Should the price break out of the flag formation, which is highly likely, it could rise to the target price of $62.72 (61.64 - 40,90 = 20.74 + 41.98 = 62.72). Definitely a stock to watch and buy at the lower levels. |
Has been a technical analyst since 1969, and has worked as a futures and options trader with First Financial Futures in Johannesburg, South Africa.
| Address: | 3256 West 24th Ave |
| Vancouver, BC | |
| Phone # for sales: | 6042634214 |
| E-mail address: | petroosp@gmail.com |
Click here for more information about our publications!
Comments
Date:�04/22/08Rank:�5Comment:�

Request Information From Our Sponsors
- VectorVest, Inc.
- Executive Premier Workshop
- One-Day Options Course
- OptionsPro
- Retirement Income Workshop
- Sure-Fire Trading Systems (VectorVest, Inc.)
- Trading as a Business Workshop
- VectorVest 7 EOD
- VectorVest 7 RealTime/IntraDay
- VectorVest AutoTester
- VectorVest Educational Services
- VectorVest OnLine
- VectorVest Options Analyzer
- VectorVest ProGraphics v6.0
- VectorVest ProTrader 7
- VectorVest RealTime Derby Tool
- VectorVest Simulator
- VectorVest Variator
- VectorVest Watchdog
- StockCharts.com, Inc.
- Candle Patterns
- Candlestick Charting Explained
- Intermarket Technical Analysis
- John Murphy on Chart Analysis
- John Murphy's Chart Pattern Recognition
- John Murphy's Market Message
- MurphyExplainsMarketAnalysis-Intermarket Analysis
- MurphyExplainsMarketAnalysis-Visual Analysis
- StockCharts.com
- Technical Analysis of the Financial Markets
- The Visual Investor