HOT TOPICS LIST
- MACD
- Fibonacci
- RSI
- Gann
- ADXR
- Stochastics
- Volume
- Triangles
- Futures
- Cycles
- Volatility
- ZIGZAG
- MESA
- Retracement
- Aroon
INDICATORS LIST
LIST OF TOPICS
PRINT THIS ARTICLE
by David Penn
The Easter Week rally has reclaimed 41% of the spring decline. But the trend is still down.
Position: N/A
David Penn
Technical Writer for Technical Analysis of STOCKS & COMMODITIES magazine, Working-Money.com, and Traders.com Advantage.
PRINT THIS ARTICLE
TECHNICAL ANALYSIS
Rallies and Their Discontents
04/24/01 08:07:54 AMby David Penn
The Easter Week rally has reclaimed 41% of the spring decline. But the trend is still down.
Position: N/A
| A frequently aired SUV commercial depicts a group of outdoorsy guys chasing off a group of bears who had the temerity to invade their campsite and "mess with a man's salad"--or so the punch lines goes. Although the commercial airs with a disclaimer at the bottom of the screen suggesting that it is a bad idea for men (even outdoorsy SUV-driving men) to attempt to assault a group of bears, one cannot escape the suspicion that Ford believes that, all other things being equal, there's nothing more noble than fighting off a group of bears. |
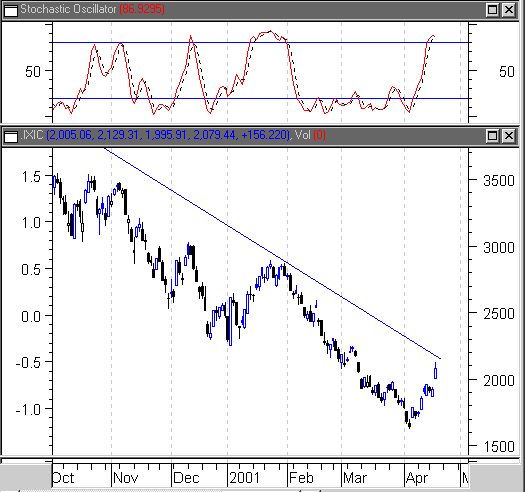
| I think of this ursa abuse when listening to conversations about the Easter Week rally. Having battered investors for months with relentless declines, the Nasdaq is staging the most powerful rally of its bearish season. The Nasdaq is up from about 1,600 back into the low 2,000s, and retraced a significant 41% of the previous decline--which ran from a January 30 high of 2,861 to an April 4 low of 1,620. Not since the late December/early January rally has so much capital been committed to buying the Nasdaq. |

|
| Rally be damned ... Advances approaching downward trendlines often provide opportunities on the short side. |
| Graphic provided by: TradeStation. |
| |
| Unfortunately, the Nasdaq chart suggests that the Easter Week rally is one of those most characteristic creatures of the bear market: the bear market rally. Even during the savage declines of a bear market, powerful countertrend rallies occur as techicians respond to oversold conditions, fundamentally oriented value investors start scooping up perceived bargains, and the fear and dread that had so characterized investors psychology turns into its opposite: greed. Not that greed is bad, as such. But greed, just like fear, has its limits. And just as fear reached its limit around 1,620, so does it appear that a downward trendline that has provided stiff resistance to four previous rallies will again put a limit on greed. |
| The downward trendline covers seven months from the September high of 4,260, as the chart shows. There are steeper trendlines that could be drawn; for example, including the early November and early December peaks. This would make the January peak a failed trendline breakout. Because of the resumption of the downtrend, I am less inclined to include the November and December peaks and more inclined to make the January peak a more significant point in the downtrend. The stochastic oscillator is also provided to show the coincidence of failed rallies (or trendline approaches, depending on how the line is drawn) and overbought conditions. |
| The combination of the stochastic oscillator's overbought reading (similarly overbought conditions in September and January were followed by steep declines) and the Nasdaq composite's approach of a major downward trendline suggest that there is still some upside to the Easter Week rally. But one of the old saws of trend-following suggests that rallies approaching downward trendlines can often be profitably sold. Whether this Easter Week rally will turn into a May Day Parade (or at least a capitalist version of one), will have everything to do with how the Nasdaq reacts to its seven-month downtrend and how the composite's overbought reading is resolved. |
Technical Writer for Technical Analysis of STOCKS & COMMODITIES magazine, Working-Money.com, and Traders.com Advantage.
| Title: | Technical Writer |
| Company: | Technical Analysis, Inc. |
| Address: | 4757 California Avenue SW |
| Seattle, WA 98116 | |
| Phone # for sales: | 206 938 0570 |
| Fax: | 206 938 1307 |
| Website: | www.Traders.com |
| E-mail address: | DPenn@traders.com |
Traders' Resource Links | |
| Charting the Stock Market: The Wyckoff Method -- Books | |
| Working-Money.com -- Online Trading Services | |
| Traders.com Advantage -- Online Trading Services | |
| Technical Analysis of Stocks & Commodities -- Publications and Newsletters | |
| Working Money, at Working-Money.com -- Publications and Newsletters | |
| Traders.com Advantage -- Publications and Newsletters | |
| Professional Traders Starter Kit -- Software | |
Click here for more information about our publications!
Comments
Date: 05/01/01Rank: Comment: do you know anything about the stock ;attt; it was trading two or three weeks ago. a penny stock,the bottom droped out, down to .001 and then it quit trading altogether, is this common?

|

Request Information From Our Sponsors
- VectorVest, Inc.
- Executive Premier Workshop
- One-Day Options Course
- OptionsPro
- Retirement Income Workshop
- Sure-Fire Trading Systems (VectorVest, Inc.)
- Trading as a Business Workshop
- VectorVest 7 EOD
- VectorVest 7 RealTime/IntraDay
- VectorVest AutoTester
- VectorVest Educational Services
- VectorVest OnLine
- VectorVest Options Analyzer
- VectorVest ProGraphics v6.0
- VectorVest ProTrader 7
- VectorVest RealTime Derby Tool
- VectorVest Simulator
- VectorVest Variator
- VectorVest Watchdog
- StockCharts.com, Inc.
- Candle Patterns
- Candlestick Charting Explained
- Intermarket Technical Analysis
- John Murphy on Chart Analysis
- John Murphy's Chart Pattern Recognition
- John Murphy's Market Message
- MurphyExplainsMarketAnalysis-Intermarket Analysis
- MurphyExplainsMarketAnalysis-Visual Analysis
- StockCharts.com
- Technical Analysis of the Financial Markets
- The Visual Investor
