HOT TOPICS LIST
- MACD
- Fibonacci
- RSI
- Gann
- ADXR
- Stochastics
- Volume
- Triangles
- Futures
- Cycles
- Volatility
- ZIGZAG
- MESA
- Retracement
- Aroon
INDICATORS LIST
LIST OF TOPICS
PRINT THIS ARTICLE
by Koos van der Merwe
Is this a double top I see before me?
Position: N/A
Koos van der Merwe
Has been a technical analyst since 1969, and has worked as a futures and options trader with First Financial Futures in Johannesburg, South Africa.
PRINT THIS ARTICLE
OSCILLATORS
Research In Motion
04/18/08 12:37:14 PMby Koos van der Merwe
Is this a double top I see before me?
Position: N/A
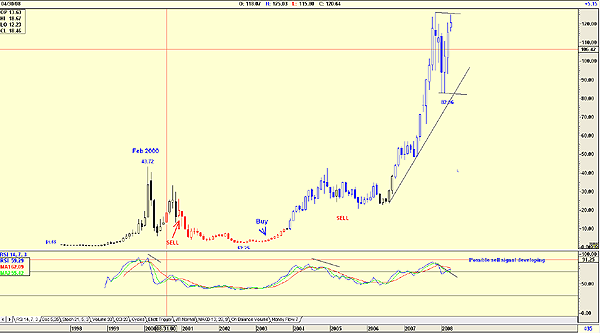
| The BlackBerry has become synonymous with instant communication, remaining in touch with whatever and whoever, wherever. The rise in the share price has been phenomenal, as you can see from Figure 1, but is a double top developing, with a major correction down giving one an opportunity to buy at lower levels? Figure 1 is a monthly chart and shows how Research in Motion moved from a low of $1.55 in October 1997 to a high of $126.34 by November 2007. |

|
| FIGURE 1: RESEARCH IN MOTION, MONTHLY. Note how this stock moved from a low of $1.55 in October 1997 to a high of $126.34 by November 2007. |
| Graphic provided by: AdvancedGET. |
| |
| My indicator of choice is the JM Internal band. This is a 15-period simple moving average band with a 4% offset in this chart. I have shown the buy and sell signals, and had you followed the indicator, you would have done very well indeed. My second indicator, a relative strength index (RSI)(14), is at overbought levels, suggesting a possible divergent sell signal is in the offing. Note how RIM corrected on previous RSI overbought positions. |

|
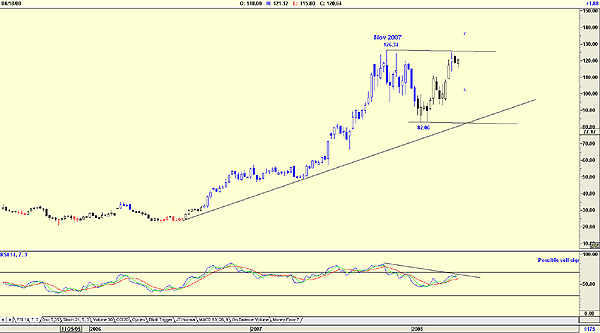
| FIGURE 2: RESEARCH IN MOTION, WEEKLY. Note the double top that is forming, suggesting that the stock could fall to test the $82.06 level. |
| Graphic provided by: AdvancedGET. |
| |
| Figure 2 is a weekly chart and highlights the double top that is forming. This suggests that in the correction, RIM could fall to test the $82.06 level. |

|
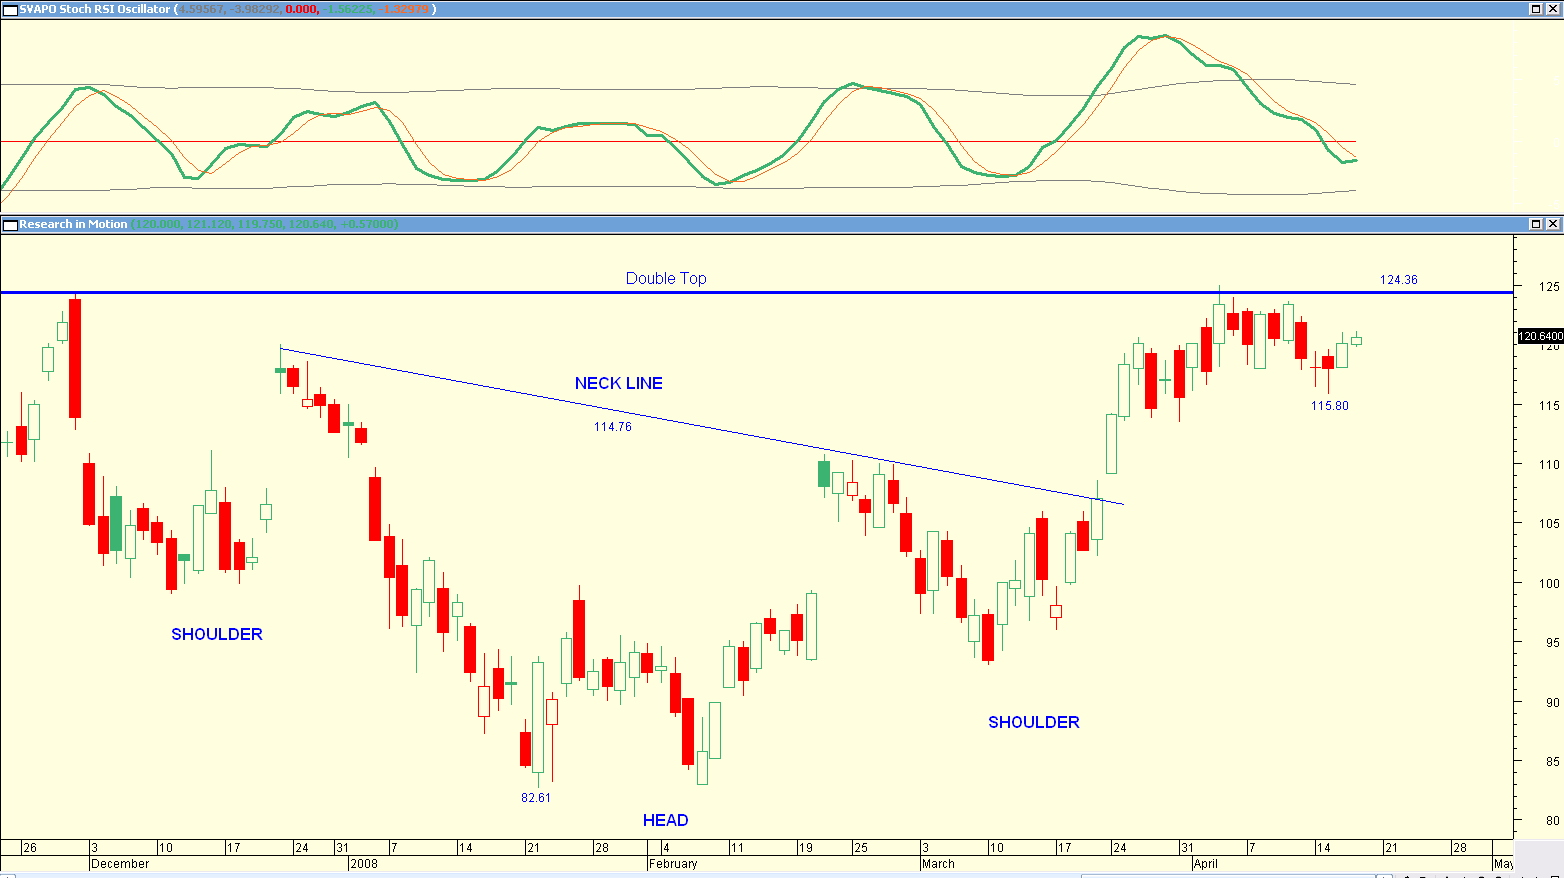
| FIGURE 3: RESEARCH IN MOTION, DAILY. A short-term inverted head & shoulders could be developing. |
| Graphic provided by: MetaStock. |
| |
| Figure 3 is a daily chart. The chart suggests that a short-term inverted head & shoulders pattern could be developing. This is contrary to what the monthly and weekly charts are suggesting. The target for the rise is $146.91 (114.76 - 82.61 = 31.15 + 114.76 = 146.91). The chart shows how the price is currently flirting with the double-top level of $124.36. A move above this level could then confirm the H&S target of $146.91. Finally, the indicator shown on Figure 3 is a SVAPO with a three-period moving average. This use of the indicator is not in line with the advice of its developer, Sylvain Vervoort, on how to use it. He suggested we should use it with another indicator as a confirmation indicator. I have found that it is pretty good on its own. To conclude, Research in Motion is a stock that could be placed on your watchlist. A break above $124.36 will see it rise to a target of $146.91, but weekly and monthly charts are suggesting weakness rather than strength, and a move below the pivot point of $115.80 will confirm weakness. |
Has been a technical analyst since 1969, and has worked as a futures and options trader with First Financial Futures in Johannesburg, South Africa.
| Address: | 3256 West 24th Ave |
| Vancouver, BC | |
| Phone # for sales: | 6042634214 |
| E-mail address: | petroosp@gmail.com |
Click here for more information about our publications!
Comments
Date: 04/19/08Rank: 3Comment:

Request Information From Our Sponsors
- StockCharts.com, Inc.
- Candle Patterns
- Candlestick Charting Explained
- Intermarket Technical Analysis
- John Murphy on Chart Analysis
- John Murphy's Chart Pattern Recognition
- John Murphy's Market Message
- MurphyExplainsMarketAnalysis-Intermarket Analysis
- MurphyExplainsMarketAnalysis-Visual Analysis
- StockCharts.com
- Technical Analysis of the Financial Markets
- The Visual Investor
- VectorVest, Inc.
- Executive Premier Workshop
- One-Day Options Course
- OptionsPro
- Retirement Income Workshop
- Sure-Fire Trading Systems (VectorVest, Inc.)
- Trading as a Business Workshop
- VectorVest 7 EOD
- VectorVest 7 RealTime/IntraDay
- VectorVest AutoTester
- VectorVest Educational Services
- VectorVest OnLine
- VectorVest Options Analyzer
- VectorVest ProGraphics v6.0
- VectorVest ProTrader 7
- VectorVest RealTime Derby Tool
- VectorVest Simulator
- VectorVest Variator
- VectorVest Watchdog
