

HOT TOPICS LIST
- MACD
- Fibonacci
- RSI
- Gann
- ADXR
- Stochastics
- Volume
- Triangles
- Futures
- Cycles
- Volatility
- ZIGZAG
- MESA
- Retracement
- Aroon
INDICATORS LIST
LIST OF TOPICS
PRINT THIS ARTICLE
by Chaitali Mohile
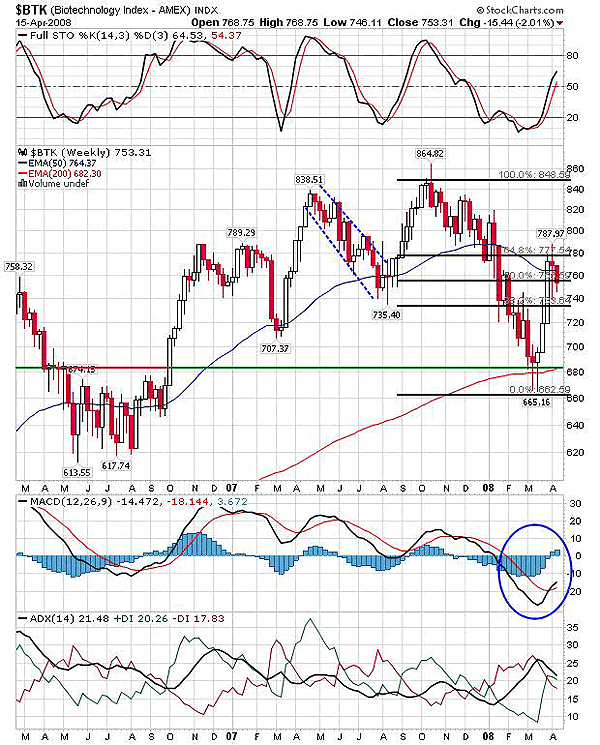
The pullback rally has turned sideways in between the two Fibonacci retracements levels for the biotech index. This support-resistance area is also intercepted by the moving average hurdle.
Position: N/A
Chaitali Mohile
Active trader in the Indian stock markets since 2003 and a full-time writer. Trading is largely based upon technical analysis.
PRINT THIS ARTICLE
SUPPORT & RESISTANCE
Biotechnology Index Crushed In Crucial Areas
04/21/08 12:27:31 PMby Chaitali Mohile
The pullback rally has turned sideways in between the two Fibonacci retracements levels for the biotech index. This support-resistance area is also intercepted by the moving average hurdle.
Position: N/A
| Between May and July, 2006, the Biotechnology Index, was moving in the 620-680 range with high volatility. Various attempts were made to violate the upper resistance, but due to lack of strength and high volatility, the index consolidated at lower levels and formed a strong bottom. The stochastic (14,3,3) was indicating that a bullish rally may lie ahead, since the indicator had already begun its upside move from the oversold area. The moment the resistance was converted to support, a strong bullish rally was initiated that made new highs. At the same time the stochastic was hitting the overbought areas. The price chased the exponential moving average. On the breakout, price retraced toward the EMA 50, and as a result, every upside swing was followed by a vertical correction, which lost most of the gains from the bullish rally. This action was repeated twice, but the EMA proved to be a boon for the rally, and $BTK surged back to previous highs. |
|
| FIGURE 1: $BTK, WEEKLY. The Fibonacci retracement level and the 50-day EMA together has compressed the index movement. Sustaining between this support-resistance zone by consolidating is healthy for the bullish rally ahead. |
| Graphic provided by: StockCharts.com. |
| |
| The stochastic also reached overbought levels as the price made new highs and slipped with equal speed, resulting in a declining price from the top. But the plunge from the 838-840 area failed to respect the EMA 50 support and slipped even further to kiss the 200-day EMA. The support-resistance line showed in Figure 1 and the 200-day EMA have the same collision points, creating the strong support-resistance zone. Thus, a fresh pullback rally was born from the same zone, with stronger bullish pressure. The average directional movement index (ADX) (14), though, shows a developing uptrend, and we can see a sudden rise in buying pressure. So even in a downtrend, the bulls try their hands, pulling the index higher. |
| The index has now recovered almost 64.8% retracement levels and turned sideways. However, the 50-day EMA now stands as support as well as resistance for the rally. The moving average convergence/divergence (MACD) (12,26,9) is trying to sustain above the trigger line, whereas the MACD histogram has already moved above the zero line. Thus, this indicator leaves a positive view for a temporary phase. And the stochastic (14,3,3) is in the bullish area. As long as the retracement levels' support of 50% and resistance of 64.8% along with the 50-day EMA is held, bullish sentiments will sustain. But the index price will be crushed between the support and resistance. The sideways move in this narrower range will be healthier than slipping below the mentioned supports. |
Active trader in the Indian stock markets since 2003 and a full-time writer. Trading is largely based upon technical analysis.
| Company: | Independent |
| Address: | C1/3 Parth Indraprasth Towers. Vastrapur |
| Ahmedabad, Guj 380015 | |
| E-mail address: | chaitalimohile@yahoo.co.in |
Traders' Resource Links | |
| Independent has not added any product or service information to TRADERS' RESOURCE. | |
Click here for more information about our publications!
Comments
Date:�04/22/08Rank:�3Comment:�

Request Information From Our Sponsors
- VectorVest, Inc.
- Executive Premier Workshop
- One-Day Options Course
- OptionsPro
- Retirement Income Workshop
- Sure-Fire Trading Systems (VectorVest, Inc.)
- Trading as a Business Workshop
- VectorVest 7 EOD
- VectorVest 7 RealTime/IntraDay
- VectorVest AutoTester
- VectorVest Educational Services
- VectorVest OnLine
- VectorVest Options Analyzer
- VectorVest ProGraphics v6.0
- VectorVest ProTrader 7
- VectorVest RealTime Derby Tool
- VectorVest Simulator
- VectorVest Variator
- VectorVest Watchdog
- StockCharts.com, Inc.
- Candle Patterns
- Candlestick Charting Explained
- Intermarket Technical Analysis
- John Murphy on Chart Analysis
- John Murphy's Chart Pattern Recognition
- John Murphy's Market Message
- MurphyExplainsMarketAnalysis-Intermarket Analysis
- MurphyExplainsMarketAnalysis-Visual Analysis
- StockCharts.com
- Technical Analysis of the Financial Markets
- The Visual Investor