HOT TOPICS LIST
- MACD
- Fibonacci
- RSI
- Gann
- ADXR
- Stochastics
- Volume
- Triangles
- Futures
- Cycles
- Volatility
- ZIGZAG
- MESA
- Retracement
- Aroon
INDICATORS LIST
LIST OF TOPICS
PRINT THIS ARTICLE
by Chaitali Mohile
Among the technology stocks, Cisco has been bitterly affected and could continue its bad performance during the downtrend.
Position: Sell
Chaitali Mohile
Active trader in the Indian stock markets since 2003 and a full-time writer. Trading is largely based upon technical analysis.
PRINT THIS ARTICLE
BULL/BEAR MARKET
Cisco An Underperforming Stock
04/17/08 12:43:12 PMby Chaitali Mohile
Among the technology stocks, Cisco has been bitterly affected and could continue its bad performance during the downtrend.
Position: Sell
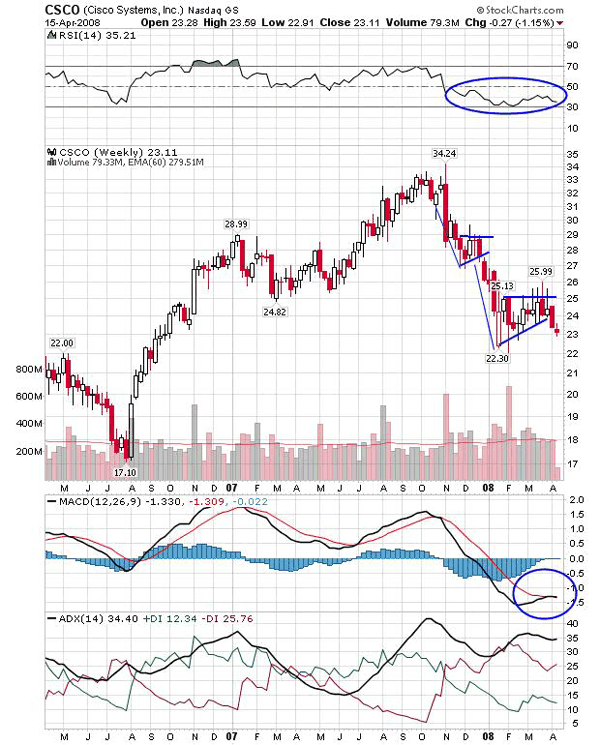
| Cisco began its upward journey in mid-2006 from the lowest point of 17.10. The stock had a relatively healthy bullish rally. It consolidated and then continued to move higher. But as the stock raced ahead, the volume turned out to be very volatile, perhaps because of the divergence on the relative strength index (RSI)(14). The RSI (14) was reluctant to test new levels above 70 while prices were moving higher. Instead, the oscillator moved just in the bullish range of 50-70. The divergence shows the effect very slowly most of the time. The price movement finally tired out at 34.24, and further movement turned sideways before correcting. See Figure 1. |

|
| FIGURE 1: CSCO, WEEKLY. The breakout target of a bearish flag & pennant pattern is much closer to the previous low of the stock. The stock continues to underperform with this declining rally. |
| Graphic provided by: StockCharts.com. |
| |
| Since then, bears have had control over the stock and volatility has turned higher. The RSI (14) moved below the bullish support of 50, indicating bearish pressure on the rallies and remaining in the 30-50 range. A new downtrend was in action now, with increasing selling pressure. The moving average convergence/divergence (MACD) (12,26,9) too had a bearish crossover. So overall, the bullish picture became bearish due to high volatility and negative divergence. |
| A bearish flag & pennant formed twice during the downside rally. The stock has reached the levels of 23 and shows the possibility of a breakdown. The bearish flag & pennant is about to break down and the indicators are still deeply bearish. So the stock is likely to remain an underperformer in the near future. The bearish breakout can be traded by going short either with a calculated target or on previous levels. The length of a declining rally on the flag is 28 - 22 = 6, so subtracting 6 from the breakout level of 24, we get the estimated level of 18. This minimum level coincides with the previous support of 17.10, too. |
| The average directional movement index (ADX) (14) shows a well-developed downtrend. In addition, the MACD (12,26,9) is tangled with the trigger line in negative territory. |
| For additional confirmation, the ADX (14) on the daily chart shows a very weak trend with a tough battle between bearish and bullish pressure. The ADX is at 8, so the volatility is going to be high. Thus, the stock would continue to underperform. |
Active trader in the Indian stock markets since 2003 and a full-time writer. Trading is largely based upon technical analysis.
| Company: | Independent |
| Address: | C1/3 Parth Indraprasth Towers. Vastrapur |
| Ahmedabad, Guj 380015 | |
| E-mail address: | chaitalimohile@yahoo.co.in |
Traders' Resource Links | |
| Independent has not added any product or service information to TRADERS' RESOURCE. | |
Click here for more information about our publications!
Comments
Date: 04/17/08Rank: 4Comment:

Request Information From Our Sponsors
- StockCharts.com, Inc.
- Candle Patterns
- Candlestick Charting Explained
- Intermarket Technical Analysis
- John Murphy on Chart Analysis
- John Murphy's Chart Pattern Recognition
- John Murphy's Market Message
- MurphyExplainsMarketAnalysis-Intermarket Analysis
- MurphyExplainsMarketAnalysis-Visual Analysis
- StockCharts.com
- Technical Analysis of the Financial Markets
- The Visual Investor
- VectorVest, Inc.
- Executive Premier Workshop
- One-Day Options Course
- OptionsPro
- Retirement Income Workshop
- Sure-Fire Trading Systems (VectorVest, Inc.)
- Trading as a Business Workshop
- VectorVest 7 EOD
- VectorVest 7 RealTime/IntraDay
- VectorVest AutoTester
- VectorVest Educational Services
- VectorVest OnLine
- VectorVest Options Analyzer
- VectorVest ProGraphics v6.0
- VectorVest ProTrader 7
- VectorVest RealTime Derby Tool
- VectorVest Simulator
- VectorVest Variator
- VectorVest Watchdog
