HOT TOPICS LIST
- MACD
- Fibonacci
- RSI
- Gann
- ADXR
- Stochastics
- Volume
- Triangles
- Futures
- Cycles
- Volatility
- ZIGZAG
- MESA
- Retracement
- Aroon
INDICATORS LIST
LIST OF TOPICS
PRINT THIS ARTICLE
by Mike Carr, CMT
With the International Monetary Fund deciding to sell more than 13 million ounces of gold, is now the time to take a short position?
Position: Sell
Mike Carr, CMT
Mike Carr, CMT, is a member of the Market Technicians Association, and editor of the MTA's newsletter, Technically Speaking. He is also the author of "Smarter Investing in Any Economy: The Definitive Guide to Relative Strength Investing," and "Conquering the Divide: How to Use Economic Indicators to Catch Stock Market Trends."
PRINT THIS ARTICLE
STRATEGIES
Revisiting Gold
04/16/08 10:17:56 AMby Mike Carr, CMT
With the International Monetary Fund deciding to sell more than 13 million ounces of gold, is now the time to take a short position?
Position: Sell
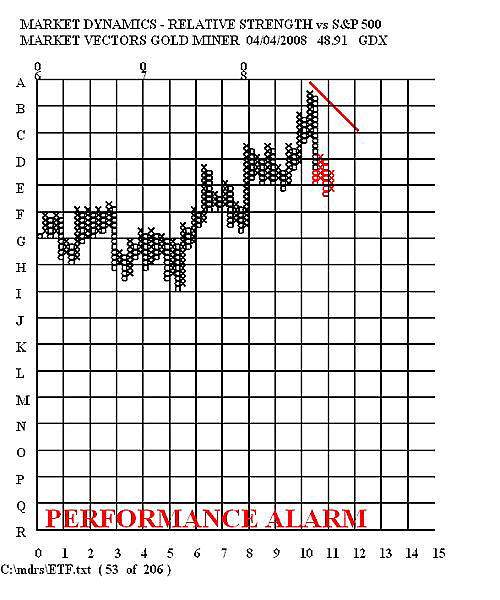
| Recently, I recommended Royal Gold (RGLD) as a leveraged trading opportunity to profit from rising gold prices. The fundamentals have recently shifted in that market and the trade should be closed. Actually, short positions in the yellow metal should be considered by aggressive traders. While mining companies can outperform gold bullion, they are also considered to be leading indicators of the price of the gold. Although RGLD has held up, many other mining stocks have broken down, and the Market Vectors Gold Miner ETF (GDX) is showing a sell signal on a point & figure chart of its relative strength (Figure 1). |

|
| FIGURE 1: GDX. GDX has recently broken down and is underperforming the market. It has often led changes in the trend of gold bullion prices. |
| Graphic provided by: Market Dynamics. |
| |
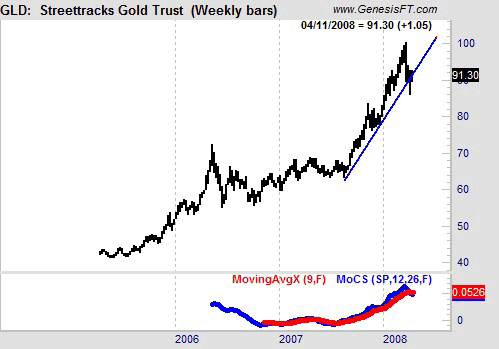
| The large sale by the IMF is likely to put additional pressure on prices. The chart of Streettracks Gold Trust (GLD) in Figure 2 is already showing signs of topping. In addition, relative strength, as measured by the momentum of comparative strength, has turned bearish on the monthly chart. This indicator compares GLD to the Standard & Poor's 500, indicating that stocks are more attractive than gold at this time. |

|
| FIGURE 2: GLD, WEEKLY. After breaking a near-parabolic upward trendline, GLD is at a critical price level. |
| Graphic provided by: Trade Navigator. |
| |
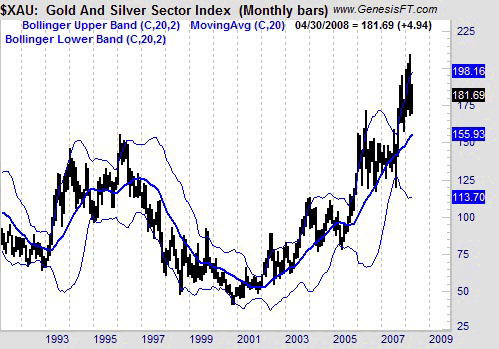
| The rapid rise in gold prices has been unprecedented. On a monthly basis, the gold and silver sector index (XAU) has traded more than two standard deviations above its 20-month moving average in each of the last seven months (Figure 3). When the Internet bubble burst, the NASDAQ Composite Index traded at this extreme level for only five months. |

|
| FIGURE 3: XAU, MONTHLY. Although XAU is volatile, recent price action has been unusually volatile. Consolidation, or retracement, is likely at current levels. |
| Graphic provided by: Trade Navigator. |
| |
| The recent explosive up move in gold is likely to be at least partially reversed. With so much gold coming into the marketplace, supply will likely overwhelm demand. Traders may want to consider shorting GLD, or taking a position in the futures market to profit from this opportunity. |
Mike Carr, CMT, is a member of the Market Technicians Association, and editor of the MTA's newsletter, Technically Speaking. He is also the author of "Smarter Investing in Any Economy: The Definitive Guide to Relative Strength Investing," and "Conquering the Divide: How to Use Economic Indicators to Catch Stock Market Trends."
| Website: | www.moneynews.com/blogs/MichaelCarr/id-73 |
| E-mail address: | marketstrategist@gmail.com |
Click here for more information about our publications!
Comments
Date: 04/16/08Rank: 5Comment:

Request Information From Our Sponsors
- VectorVest, Inc.
- Executive Premier Workshop
- One-Day Options Course
- OptionsPro
- Retirement Income Workshop
- Sure-Fire Trading Systems (VectorVest, Inc.)
- Trading as a Business Workshop
- VectorVest 7 EOD
- VectorVest 7 RealTime/IntraDay
- VectorVest AutoTester
- VectorVest Educational Services
- VectorVest OnLine
- VectorVest Options Analyzer
- VectorVest ProGraphics v6.0
- VectorVest ProTrader 7
- VectorVest RealTime Derby Tool
- VectorVest Simulator
- VectorVest Variator
- VectorVest Watchdog
- StockCharts.com, Inc.
- Candle Patterns
- Candlestick Charting Explained
- Intermarket Technical Analysis
- John Murphy on Chart Analysis
- John Murphy's Chart Pattern Recognition
- John Murphy's Market Message
- MurphyExplainsMarketAnalysis-Intermarket Analysis
- MurphyExplainsMarketAnalysis-Visual Analysis
- StockCharts.com
- Technical Analysis of the Financial Markets
- The Visual Investor
