

HOT TOPICS LIST
- MACD
- Fibonacci
- RSI
- Gann
- ADXR
- Stochastics
- Volume
- Triangles
- Futures
- Cycles
- Volatility
- ZIGZAG
- MESA
- Retracement
- Aroon
INDICATORS LIST
LIST OF TOPICS
PRINT THIS ARTICLE
by David Penn
There may be more to trade than the downside breakout when it comes to head and shoulders tops.
Position: N/A
David Penn
Technical Writer for Technical Analysis of STOCKS & COMMODITIES magazine, Working-Money.com, and Traders.com Advantage.
PRINT THIS ARTICLE
HEAD & SHOULDERS
The 10-Year Treasury's Head and Shoulders Top
04/18/01 01:34:39 PMby David Penn
There may be more to trade than the downside breakout when it comes to head and shoulders tops.
Position: N/A
| One of the more aggravating experiences for chart readers has to be discovering a perfect example of a chart pattern--that has already been completed. Sure, such charts are good for impressing others and showing that there really is something to all this technical analysis stuff. They also provide examples of successful patterns for future reference. But on the, ahem, account-fattening side of things, completed chart patterns tend not to measure up. |
| The decision to pay attention to already-completed chart patterns must be made on the basis of the specific chart patterns being considered. But there are some chart patterns that lend themselves to follow-up--particularly those patterns such as head and shoulders, and double bottoms/double tops that tend to have pronounced breakouts. These are the already-completed chart patterns that are actually helpful to discover insofar as they may provide a roadmap to taking advantage of the rally or correction that likely follows a downside or upside breakout. |
|
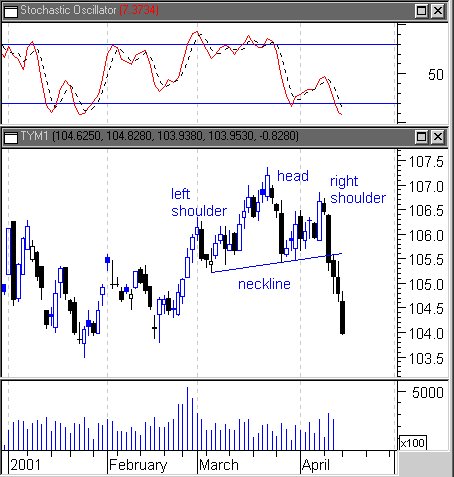
| A downside breakout in the June 10-year Treasury may mean bullish opportunities when prices inevitably rally. |
| Graphic provided by: MetaStock. |
| |
| The head and shoulders top in the 10-year Treasury bond may be an example of a completed chart pattern that may still yield profits to the correctly positioned trader. As the chart shows, the 10-year note formed a head and shoulders top beginning with the rally in late February and ending with the mid-April correction. The head of the formation lies in the March advance, which represented the high point of the 10-year note. |
| Recall that the head and shoulders top represents a series of attempts to bid up a security. The left shoulder tends to signify early buying interest, the head those informed followers of the earlier bullish activity represented by the left shoulder, and the right shoulder the last attempt by late comers to join in the bullishness (note the weaker volume on both the head and the right shoulder compared to the left, early, shoulder). The collapse and subsequent downside breakout occurs as the realization spreads that the second peak likely represented the high. Meanwhile, upside is vanishing quickly as earlier buyers from the left shoulder and head took profits. |
| Here the 10-year Treasury has experienced its downside breakout and may be on the verge of a rally. In fact, the size of the downside breakout suggests that the bears may have pushed prices down as far as they will go for the time being (the breakout is approximately the same size as the highest peak in the formation). Additionally, there appears to be some support in January and February that may halt the 10-year Treasury's slide. And it doesn't hurt that the stochastic oscillator is indicating that the note is oversold, either. At this point, it can be worthwhile to look for either bottom formations or, better still, signs of consolidation. Remember that prices tend to break down faster than they are built up, and V-shaped rallies tend to be unstable. All the same, it appears that the bearish flag is lowering over the 10-year Treasury. And when the bears retreat, can the bulls be far behind? |
Technical Writer for Technical Analysis of STOCKS & COMMODITIES magazine, Working-Money.com, and Traders.com Advantage.
| Title: | Technical Writer |
| Company: | Technical Analysis, Inc. |
| Address: | 4757 California Avenue SW |
| Seattle, WA 98116 | |
| Phone # for sales: | 206 938 0570 |
| Fax: | 206 938 1307 |
| Website: | www.Traders.com |
| E-mail address: | DPenn@traders.com |
Traders' Resource Links | |
| Charting the Stock Market: The Wyckoff Method -- Books | |
| Working-Money.com -- Online Trading Services | |
| Traders.com Advantage -- Online Trading Services | |
| Technical Analysis of Stocks & Commodities -- Publications and Newsletters | |
| Working Money, at Working-Money.com -- Publications and Newsletters | |
| Traders.com Advantage -- Publications and Newsletters | |
| Professional Traders Starter Kit -- Software | |
Click here for more information about our publications!
Comments
Date:�04/26/01Rank:�Comment:�I was wondering is there such thing as Dow Jones Islamic Index and if there is,can we trade it like the Nasdaq?

Request Information From Our Sponsors
- StockCharts.com, Inc.
- Candle Patterns
- Candlestick Charting Explained
- Intermarket Technical Analysis
- John Murphy on Chart Analysis
- John Murphy's Chart Pattern Recognition
- John Murphy's Market Message
- MurphyExplainsMarketAnalysis-Intermarket Analysis
- MurphyExplainsMarketAnalysis-Visual Analysis
- StockCharts.com
- Technical Analysis of the Financial Markets
- The Visual Investor
- VectorVest, Inc.
- Executive Premier Workshop
- One-Day Options Course
- OptionsPro
- Retirement Income Workshop
- Sure-Fire Trading Systems (VectorVest, Inc.)
- Trading as a Business Workshop
- VectorVest 7 EOD
- VectorVest 7 RealTime/IntraDay
- VectorVest AutoTester
- VectorVest Educational Services
- VectorVest OnLine
- VectorVest Options Analyzer
- VectorVest ProGraphics v6.0
- VectorVest ProTrader 7
- VectorVest RealTime Derby Tool
- VectorVest Simulator
- VectorVest Variator
- VectorVest Watchdog