

HOT TOPICS LIST
- MACD
- Fibonacci
- RSI
- Gann
- ADXR
- Stochastics
- Volume
- Triangles
- Futures
- Cycles
- Volatility
- ZIGZAG
- MESA
- Retracement
- Aroon
INDICATORS LIST
LIST OF TOPICS
PRINT THIS ARTICLE
by Mike Carr, CMT
While Frontier Airlines surprised investors with a bankruptcy announcement, relative strength investors would have steered clear of this disaster in the making before then.
Position: Sell
Mike Carr, CMT
Mike Carr, CMT, is a member of the Market Technicians Association, and editor of the MTA's newsletter, Technically Speaking. He is also the author of "Smarter Investing in Any Economy: The Definitive Guide to Relative Strength Investing," and "Conquering the Divide: How to Use Economic Indicators to Catch Stock Market Trends."
PRINT THIS ARTICLE
REL. STR COMPARATIVE
Using Relative Strength To Avoid Losers
04/14/08 09:59:10 AMby Mike Carr, CMT
While Frontier Airlines surprised investors with a bankruptcy announcement, relative strength investors would have steered clear of this disaster in the making before then.
Position: Sell
| Recently, Frontier Airlines (FRNT) joined three other small airlines in filing for bankruptcy. The stock opened the week of its filing trading at $2.15 a share, a price level that marked multiyear lows. This is the level that many value investors look to buy at, reasoning that the stock is probably as low as it can go. FRNT proved them wrong, closing the week at $0.48 a share. This demonstrated the problem of the value trap that confronts investors, which involves knowing which companies will continue falling and which are likely to rebound. |
| Technicians can rely on relative strength to avoid the value trap. The idea behind relative strength is to buy stocks that are going up and sell them when they are going down. Numerous approaches to this methodology exist. Among the most popular ways to apply relative strength is to rank each stock the way Investor's Business Daily does, assigning a rank of 99 to the strongest stocks and 1 to the worst performers. This requires software to score each stock in the markets, something that may be beyond the capabilities of many small investors. |
| A simple approach to evaluating a single stock is to chart the ratio of the stock's price changes to the change in a market average such as the Standard & Poor's 500. A rising line means the stock is stronger than the market, while a declining line indicates it is lagging the market. This ratio can also be charted as a point & figure chart (Figure 1). |
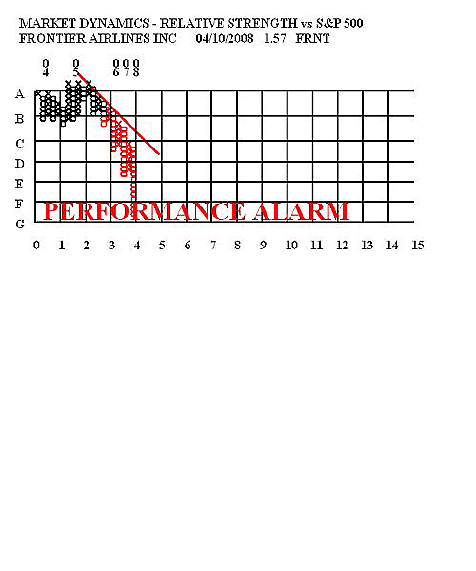
|
| FIGURE 1: FRONTIER AIRLINES, P&F. The point & figure chart of relative strength for FRNT has been on a clear sell signal since late 2005. |
| Graphic provided by: Market Dynamics. |
| |
| The advantages of point & figure charts include the fact that there is always a clear buy or sell signal and the daily market noise is removed, allowing traders to focus on the long-term trend. For FRNT, the chart shows that the trend of relative strength has been down for more than two years, making this a poor candidate for long positions in a portfolio. |
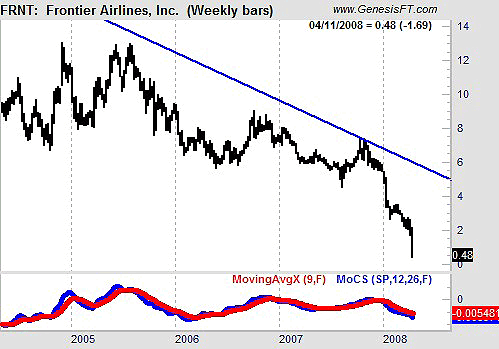
|
| FIGURE 2: MOMENTUM OF COMPARATIVE STRENGTH (MOCS). The MOCS indicator offers clear buy & sell signals and works very well when combined with simple trendline analysis to avoid potential losing trades. |
| Graphic provided by: Trade Navigator. |
| |
| Another approach to evaluating relative strength for a single stock is shown in Figure 2. The momentum of comparative strength (MOCS) indicator applies the moving average convergence/divergence (MACD) calculation to relative strength. The result? Clear signals have shown that FRNT should be avoided for all but very short trades since the middle of 2005. To increase the probability of winning trades, traders should avoid MOCS buy signals for stocks like FRNT when they are below long-term down trendlines. Applying relative strength analysis to any trade can help investors get on the right side of trades more often. This simple tool can be applied as a filter to both long and short strategies. |
Mike Carr, CMT, is a member of the Market Technicians Association, and editor of the MTA's newsletter, Technically Speaking. He is also the author of "Smarter Investing in Any Economy: The Definitive Guide to Relative Strength Investing," and "Conquering the Divide: How to Use Economic Indicators to Catch Stock Market Trends."
| Website: | www.moneynews.com/blogs/MichaelCarr/id-73 |
| E-mail address: | marketstrategist@gmail.com |
Click here for more information about our publications!
Comments
Date:�04/15/08Rank:�5Comment:�Nice going. My book will be out this summer with ways to do the calculations on line. Charlie
Date:�04/15/08Rank:�4Comment:�
Date:�04/15/08Rank:�2Comment:�

Request Information From Our Sponsors
- StockCharts.com, Inc.
- Candle Patterns
- Candlestick Charting Explained
- Intermarket Technical Analysis
- John Murphy on Chart Analysis
- John Murphy's Chart Pattern Recognition
- John Murphy's Market Message
- MurphyExplainsMarketAnalysis-Intermarket Analysis
- MurphyExplainsMarketAnalysis-Visual Analysis
- StockCharts.com
- Technical Analysis of the Financial Markets
- The Visual Investor
- VectorVest, Inc.
- Executive Premier Workshop
- One-Day Options Course
- OptionsPro
- Retirement Income Workshop
- Sure-Fire Trading Systems (VectorVest, Inc.)
- Trading as a Business Workshop
- VectorVest 7 EOD
- VectorVest 7 RealTime/IntraDay
- VectorVest AutoTester
- VectorVest Educational Services
- VectorVest OnLine
- VectorVest Options Analyzer
- VectorVest ProGraphics v6.0
- VectorVest ProTrader 7
- VectorVest RealTime Derby Tool
- VectorVest Simulator
- VectorVest Variator
- VectorVest Watchdog