HOT TOPICS LIST
- MACD
- Fibonacci
- RSI
- Gann
- ADXR
- Stochastics
- Volume
- Triangles
- Futures
- Cycles
- Volatility
- ZIGZAG
- MESA
- Retracement
- Aroon
INDICATORS LIST
LIST OF TOPICS
PRINT THIS ARTICLE
by James Kupfer
USO may be poised to form a double top.
Position: Sell
James Kupfer
Mr. Kupfer is a market professional and amateur stock market commentator. Disclosure: It is likely that Mr. Kupfer has or will enter a position in any security he writes about.
PRINT THIS ARTICLE
DOUBLE TOPS
Has USO Peaked?
04/09/08 09:38:08 AMby James Kupfer
USO may be poised to form a double top.
Position: Sell
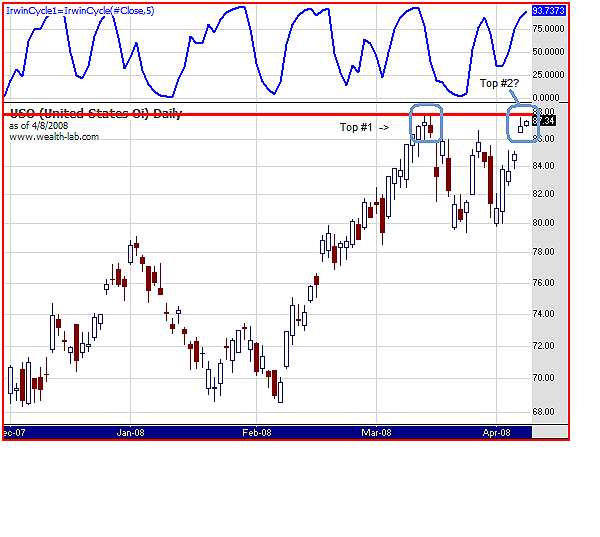
| USO, the United States Oil ETF, is very close to its all-time high and may be running out of gas to keep moving up. The high was reached on March 13, 2008, at $87.79. Prices have retreated over the last few weeks along with many other commodity prices such as gold. Now, however, prices have returned to striking distance of the old high. See Figure 1. |

|
| FIGURE 1: USO, DAILY. Prices have retreated over the last few weeks along with many other commodity prices. |
| Graphic provided by: Wealth-Lab. |
| |
| This means that USO is now on the proverbial knife's edge. Either USO continues moving up or it forms a double top and goes back down, at least for a while. A double top occurs when a security attains a recent high, retreats significantly, and then retests the recent highs. As in this case, when a security forms a double top it can become a good candidate to short or liquidate any long positions. |
| In addition to being close to the resistance formed by the previous high at $87.79, USO also appears overbought, according to the Irwin cycle indicator. This indicator is similar to the traditional fast/slow stochastic indicators most people are familiar with, although I think it provides a clearer picture than these other measures. |
| Speculators may wish to take a short position at current prices, but be sure to keep a tight stop of 2–3% above the long-term highs. Given the multiyear strength in commodities, there is plenty to suggest that even a tired USO can break the current resistance levels to even higher prices. In the near term, though, this gusher may have run dry. Up or down, this is a pivotal moment that bears watching. |
Mr. Kupfer is a market professional and amateur stock market commentator. Disclosure: It is likely that Mr. Kupfer has or will enter a position in any security he writes about.
Click here for more information about our publications!
Comments
Date: 04/10/08Rank: 5Comment:

Request Information From Our Sponsors
- VectorVest, Inc.
- Executive Premier Workshop
- One-Day Options Course
- OptionsPro
- Retirement Income Workshop
- Sure-Fire Trading Systems (VectorVest, Inc.)
- Trading as a Business Workshop
- VectorVest 7 EOD
- VectorVest 7 RealTime/IntraDay
- VectorVest AutoTester
- VectorVest Educational Services
- VectorVest OnLine
- VectorVest Options Analyzer
- VectorVest ProGraphics v6.0
- VectorVest ProTrader 7
- VectorVest RealTime Derby Tool
- VectorVest Simulator
- VectorVest Variator
- VectorVest Watchdog
- StockCharts.com, Inc.
- Candle Patterns
- Candlestick Charting Explained
- Intermarket Technical Analysis
- John Murphy on Chart Analysis
- John Murphy's Chart Pattern Recognition
- John Murphy's Market Message
- MurphyExplainsMarketAnalysis-Intermarket Analysis
- MurphyExplainsMarketAnalysis-Visual Analysis
- StockCharts.com
- Technical Analysis of the Financial Markets
- The Visual Investor
