HOT TOPICS LIST
- MACD
- Fibonacci
- RSI
- Gann
- ADXR
- Stochastics
- Volume
- Triangles
- Futures
- Cycles
- Volatility
- ZIGZAG
- MESA
- Retracement
- Aroon
INDICATORS LIST
LIST OF TOPICS
PRINT THIS ARTICLE
by Alan R. Northam
According to an analysis using moving averages to determine the future direction, XHB is now in an established intermediate-term uptrend. However, based upon an analysis using Elliott wave rules and guidelines, this uptrend is nothing more than a retracement.
Position: N/A
Alan R. Northam
Alan Northam lives in the Dallas, Texas area and as an electronic engineer gave him an analytical mind from which he has developed a thorough knowledge of stock market technical analysis. His abilities to analyze the future direction of the stock market has allowed him to successfully trade of his own portfolio over the last 30 years. Mr. Northam is now retired and trading the stock market full time. You can reach him at inquiry@tradersclassroom.com or by visiting his website at http://www.tradersclassroom.com. You can also follow him on Twitter @TradersClassrm.
PRINT THIS ARTICLE
ELLIOTT WAVE
Homebuilders Recovering?
04/08/08 01:59:50 PMby Alan R. Northam
According to an analysis using moving averages to determine the future direction, XHB is now in an established intermediate-term uptrend. However, based upon an analysis using Elliott wave rules and guidelines, this uptrend is nothing more than a retracement.
Position: N/A
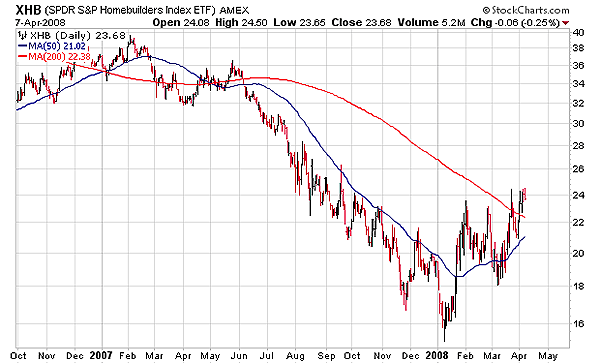
| I've heard quite a bit lately about how homebuilder stocks are recovering, so I decided to do my own investigation and see what the media is talking about. Looking at Figure 1, a daily price chart of XHB, a Standard & Poor's 500 Homebuilders Index ETF, three things pop out that I can immediately see. First of all, I see that XHB is trading above its 50-day moving average and that the moving average has been pointing upward since February. When a market is trading above its 50-day moving average and the moving average is pointing upward, technical analysts say that the market is in an intermediate-term uptrend. But what they fail to say is that intermediate-term trends last from approximately three weeks to six months. As you can see from the chart, this intermediate-term uptrend is now over eight weeks old and has fulfilled the minimum requirement in time to be classified as an intermediate-term uptrend. This also means that this intermediate-term uptrend can turn back down any time between now and July, when this intermediate-term trend would become six months old. Second, I see that XHB is now trading at its highest level over the last six months. Again, technical analyst view this as a positive indication that a recovery is underway. Third, technical analysts will also recognize that although this market is now trading above its 200-day moving average as well, this average is still pointing downward. Technical analysts will now be looking for a test of the 200-day moving average to see if it has changed from a line of resistance to a line of support and they will be looking for this moving average to turn upward. Once the 200-day moving average turns upward, technical analysts will view this market as being in a long-term uptrend. Long-term uptrends normally last from six months to two years. So everything looks rosy. XHB is now in an intermediate-term uptrend and could establish itself in a long-term uptrend within the next few months. |
| However, when I analyze XHB using the rules of Elliott wave analysis, I see a completely different picture. I prefer to use the Elliott wave rules in my market analysis because they have withstood time over the last 70 years or more. Over this period, Elliott's rules have only been violated a couple of times, which gives them a long history of being able to predict the future direction of the markets very accurately. According to Elliott, the rules used in market analysis are exact and followed exactly and are not subject to interpretation. More traditional methods of technical analaysis such as the average directional movement index (ADX), the moving average convergence/divergence (MACD), the relative strength index (RSI), stochastics, and others do not have the same long history, nor the accuracy of predicting the future direction of the markets, having only been around for 30 years or less. Nor do they have exact rules to follow in using them and as such are open to differing views of interpretation. |

|
| FIGURE 1: XHB, DAILY. This chart of XHB shows 50-day and 200-day moving averages. |
| Graphic provided by: StockCharts.com. |
| |
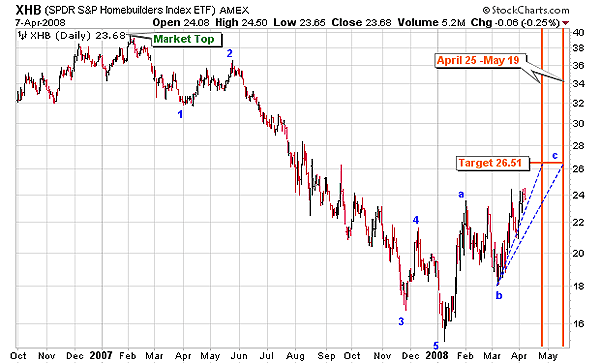
| Looking Figure 2 from an Elliott wave perspective, I see five waves in the downward direction from that market top in early February 2007. There are exact rules that must be followed in determining these five waves that we will not go into here. According to R.N. Elliott, when a market makes a five-wave move those five waves determine the direction of the market. Elliott calls these five waves an impulse wave and impulse waves make progress in price. In the case of XHB, these five waves down are predicting that the future direction of this market is down. Elliott's rules also state that after a five-wave move down, the market will retrace a portion of the total move of those five waves. This is also known as a market correction. Elliott's rules also state that after the initial five-wave move down from a market top, the retracement will be in the form of a three-wave ABC pattern called azigzag. Looking at Figure 2 again I see that XHB has now completed wave A and wave B and is working on the completion of wave C of this zigzag retracement pattern. Through the use of other Elliott wave rules and guidelines I have determined that wave C should complete somewhere in the vicinity of $26.51 and should be complete by May 19. Elliott also has a series of guidelines to follow in predicting the future price of a market. Guidelines are just that and are not as exact as the Elliott rules. |

|
| FIGURE 2: XHB, DAILY. This price chart of XHB shows Elliott wave count and price and time targets. |
| Graphic provided by: StockCharts.com. |
| |
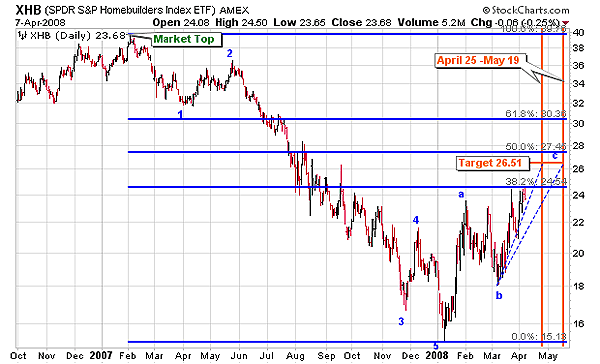
| In Figure 3 I have added the Fibonacci retracement lines. According to the Elliott wave guidelines, the first retracement, after the initial five waves down from a market top, usually retraces 61.8% of the total move of those five waves. As you can see, our price target is just shy of a 50% retracement. What this is telling me is that there exists a possibility for the current retracement to morph into a more complex retracement pattern other than a simple zigzag that would allow the retracement to continue on to higher levels. This is all within the context of Elliott's guidelines, so we will have to see what this market does once it reaches our target price level. Once the total retracement is completed, then the next five waves down will commence. |

|
| FIGURE 3: XHB, DAILY. This price chart of XHB shows Fibonacci retracement levels. |
| Graphic provided by: StockCharts.com. |
| |
| In conclusion, using an analysis based upon moving averages, the Homebuilders Index has entered into an intermediate-term uptrend. However, according to Elliott wave analysis this intermediate-term uptrend is nothing more than a retracement of the downward trend, and once this retracement is completed, the downward trend will resume. |
Alan Northam lives in the Dallas, Texas area and as an electronic engineer gave him an analytical mind from which he has developed a thorough knowledge of stock market technical analysis. His abilities to analyze the future direction of the stock market has allowed him to successfully trade of his own portfolio over the last 30 years. Mr. Northam is now retired and trading the stock market full time. You can reach him at inquiry@tradersclassroom.com or by visiting his website at http://www.tradersclassroom.com. You can also follow him on Twitter @TradersClassrm.
| Garland, Tx | |
| Website: | www.tradersclassroom.com |
| E-mail address: | inquiry@tradersclassroom.com |
Click here for more information about our publications!
Comments
Date: 04/09/08Rank: 5Comment:

Request Information From Our Sponsors
- StockCharts.com, Inc.
- Candle Patterns
- Candlestick Charting Explained
- Intermarket Technical Analysis
- John Murphy on Chart Analysis
- John Murphy's Chart Pattern Recognition
- John Murphy's Market Message
- MurphyExplainsMarketAnalysis-Intermarket Analysis
- MurphyExplainsMarketAnalysis-Visual Analysis
- StockCharts.com
- Technical Analysis of the Financial Markets
- The Visual Investor
- VectorVest, Inc.
- Executive Premier Workshop
- One-Day Options Course
- OptionsPro
- Retirement Income Workshop
- Sure-Fire Trading Systems (VectorVest, Inc.)
- Trading as a Business Workshop
- VectorVest 7 EOD
- VectorVest 7 RealTime/IntraDay
- VectorVest AutoTester
- VectorVest Educational Services
- VectorVest OnLine
- VectorVest Options Analyzer
- VectorVest ProGraphics v6.0
- VectorVest ProTrader 7
- VectorVest RealTime Derby Tool
- VectorVest Simulator
- VectorVest Variator
- VectorVest Watchdog
