HOT TOPICS LIST
- MACD
- Fibonacci
- RSI
- Gann
- ADXR
- Stochastics
- Volume
- Triangles
- Futures
- Cycles
- Volatility
- ZIGZAG
- MESA
- Retracement
- Aroon
INDICATORS LIST
LIST OF TOPICS
PRINT THIS ARTICLE
by Chaitali Mohile
Corinthian Colleges charts are showing a bearish reversal candlestick pattern and also illustrates the beginning of a new uptrend in terms of formations and trend indicator.
Position: N/A
Chaitali Mohile
Active trader in the Indian stock markets since 2003 and a full-time writer. Trading is largely based upon technical analysis.
PRINT THIS ARTICLE
TECHNICAL ANALYSIS
Is COCO Seeing A New Uptrend?
04/09/08 11:22:39 AMby Chaitali Mohile
Corinthian Colleges charts are showing a bearish reversal candlestick pattern and also illustrates the beginning of a new uptrend in terms of formations and trend indicator.
Position: N/A
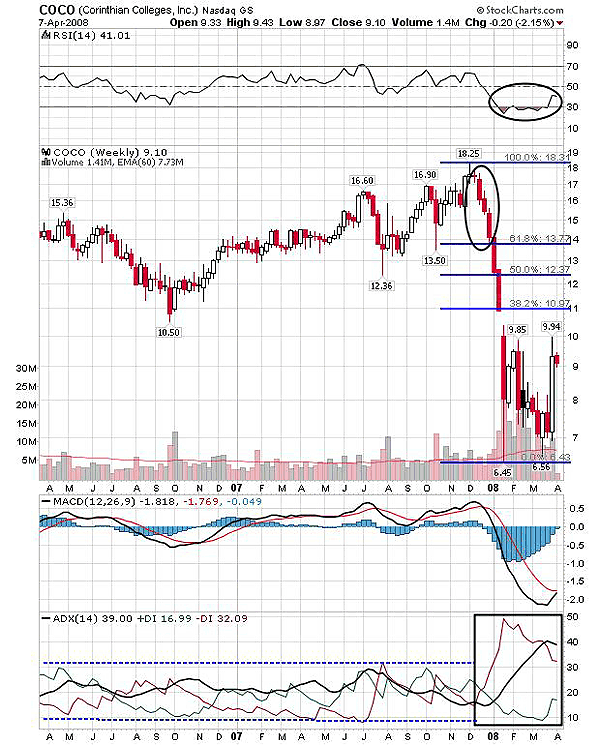
| Corinthian Colleges (COCO) has tumbled down almost 55% from its high in just four months. At the higher levels, 18.25, the stock turned sideways but was uncertain about the next move. The indecision stage of traders is reflected by the formation of doji candles in Figure 1, and as a result, bears turned stronger than the existing bulls. The first red candles would have disheartened long traders. This was followed by selling pressure and the beginning of a robust downtrend. The next two red candles formed a three-crows candlestick pattern. The pattern is a strong bearish reversal pattern that can be followed in isolation. Figure 1 confirms the strength of the pattern; the stock has taken a nose-dive thereafter, losing half the share value. This candlestick pattern appears in a well-developed uptrend, with the second and third candle opening at or near the previous day's close. This particular characteristic differentiates the pattern from three black crows. In the case of a later pattern, the candles open within the body of previous candles. |
| The Fibonacci retracement levels can also be seen as support-resistance levels or as targets in the case of a trend reversal situation. The stock is a consolidation at the lower end under the resistance of 38.2% retracement. In addition, the gap filling is an added hurdle on the bullish path ahead. Is the stock intending to surge? Or are indicators suggesting the possibility of a fresh uptrend? |

|
| FIGURE 1: COCO, WEEKLY. The three identical crows formation was the first indication of a forthcoming correction. The mixed view by all the indicators may result in a wide range-bound move that may even offer good trading opportunities. |
| Graphic provided by: StockCharts.com. |
| |
| The average directional movement index (ADX)(14) since 2006 has been very volatile and the trend played hide & seek with the bulls and the bears. The stock witnessed a choppy session during its upward rally. After the slump was done, the ADX (14) showed a marginal decline in a downtrend but a heavy reduction in selling pressure. The moving average convergence/divergence (MACD)(12,26,9) is trying for a bullish crossover, though, but we need to wait for confirmation here. The relative strength index (RSI)(14) has moved above the oversold area and is suggesting a range-bound move. Thus, the overall view on the weekly chart is mixed and can result in a wide range-bound movement with a marginally fresh buying opportunity within. |

|
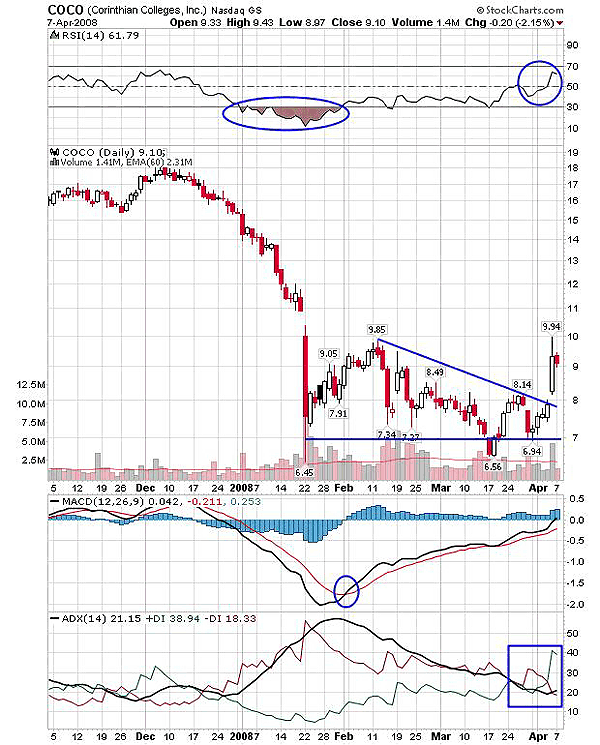
| FIGURE 2: COCO, DAILY. The Descending triangle breaking in an upward direction was the robust reversal signal. The ADX (14), MACD (12,26,9), and RSI (14) are equally turning bullish to support fresh buying. |
| Graphic provided by: StockCharts.com. |
| |
| The RSI (14) mingled in an oversold zone while the price was dragged lower. In addition, the ADX (14) in Figure 2 was overheated as price reached its lowest level. And the MACD (12,26,9) gradually moved above the trigger line. This situation suggests a bottom formation, though a subsequent surge was not indicated. On the same note, the stock moved sideways with a stable bottom, and thus, a descending triangle was formed. The descending triangle is a continuation pattern in a downtrend, but is a reversal pattern when it appears in an uptrend. Mainly, though, the triangle is a continuation pattern. In Figure 2, the pattern has already broken out in an upward direction, offering a good trading opportunity and suggesting an end to a downside move. The pattern failed as the breakout happened against the existing trend, and thus the breakout is reversed. Yes, it is much likely that the seller's line of triangle may be tested. But the long trade can be held with a stop-loss. The indicators are turning positive as well, which could be useful for short-term trading. |
| The RSI (14) has recently surged to overbought levels; here we would observe 50 as an important level for a bullish ride. The MACD (12,26,9) after a bullish crossover deep in negative territory is now moving above its zero line. The ADX (14) has a developing uptrend; therefore, the daily chart shows fresh long positions but only on a short-term basis. Thus, both charts show a change in trend at extreme levels with the help of a candlestick pattern, a continuation pattern in the price chart, and through the oscillators as well. |
Active trader in the Indian stock markets since 2003 and a full-time writer. Trading is largely based upon technical analysis.
| Company: | Independent |
| Address: | C1/3 Parth Indraprasth Towers. Vastrapur |
| Ahmedabad, Guj 380015 | |
| E-mail address: | chaitalimohile@yahoo.co.in |
Traders' Resource Links | |
| Independent has not added any product or service information to TRADERS' RESOURCE. | |
Click here for more information about our publications!
Comments
Date: 04/09/08Rank: 5Comment:
Date: 04/10/08Rank: 3Comment:

Request Information From Our Sponsors
- StockCharts.com, Inc.
- Candle Patterns
- Candlestick Charting Explained
- Intermarket Technical Analysis
- John Murphy on Chart Analysis
- John Murphy's Chart Pattern Recognition
- John Murphy's Market Message
- MurphyExplainsMarketAnalysis-Intermarket Analysis
- MurphyExplainsMarketAnalysis-Visual Analysis
- StockCharts.com
- Technical Analysis of the Financial Markets
- The Visual Investor
- VectorVest, Inc.
- Executive Premier Workshop
- One-Day Options Course
- OptionsPro
- Retirement Income Workshop
- Sure-Fire Trading Systems (VectorVest, Inc.)
- Trading as a Business Workshop
- VectorVest 7 EOD
- VectorVest 7 RealTime/IntraDay
- VectorVest AutoTester
- VectorVest Educational Services
- VectorVest OnLine
- VectorVest Options Analyzer
- VectorVest ProGraphics v6.0
- VectorVest ProTrader 7
- VectorVest RealTime Derby Tool
- VectorVest Simulator
- VectorVest Variator
- VectorVest Watchdog
